This Month’s Declinations
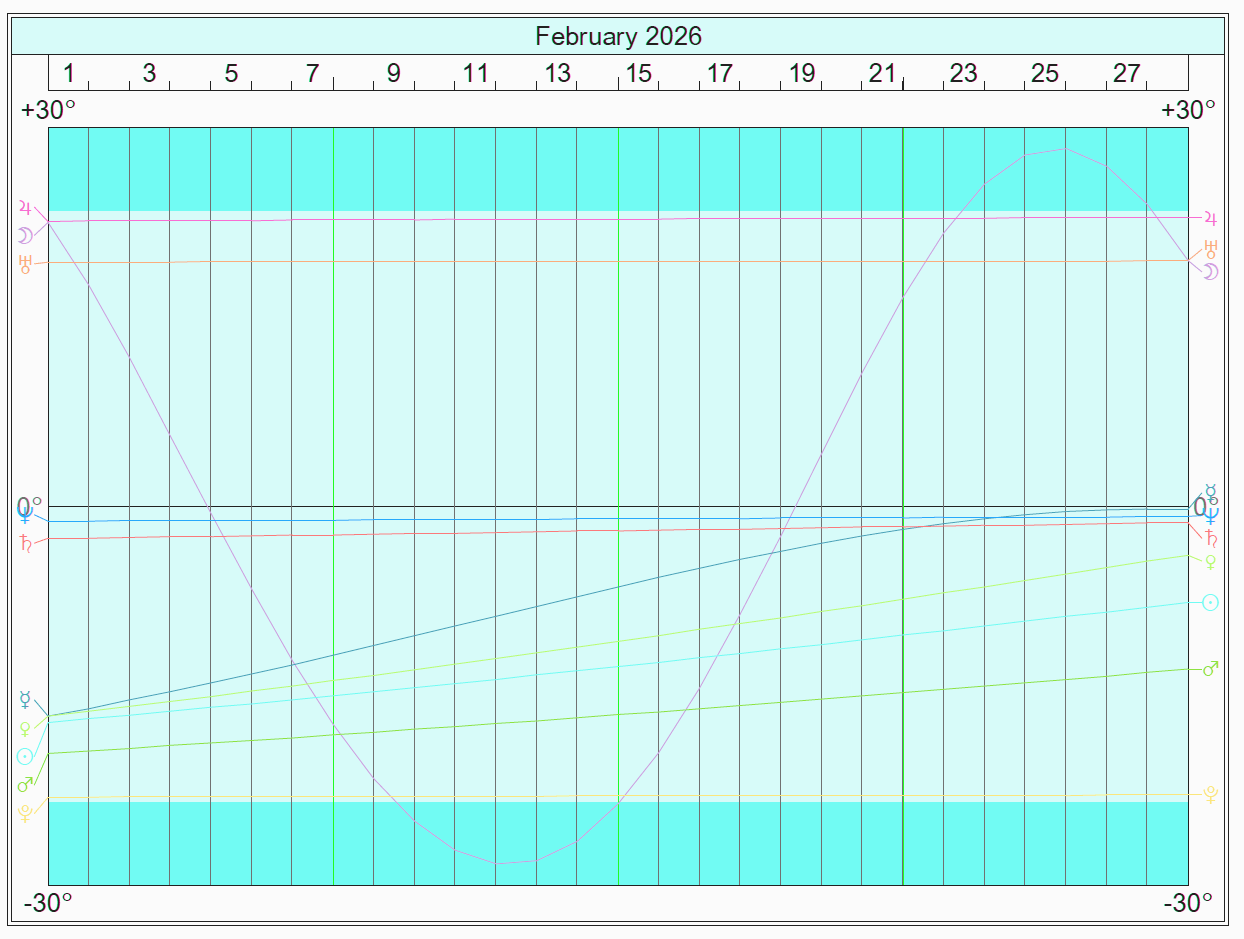
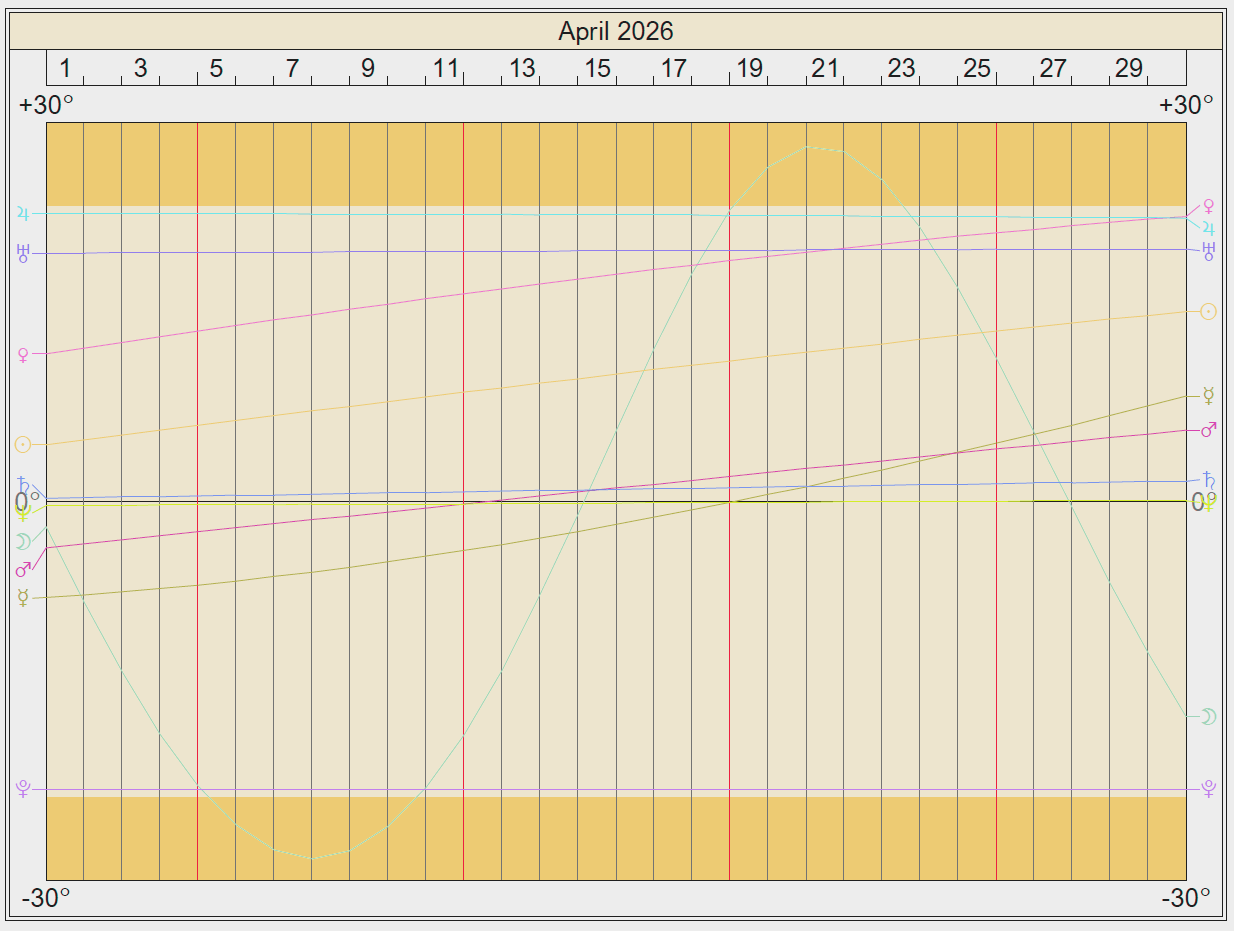
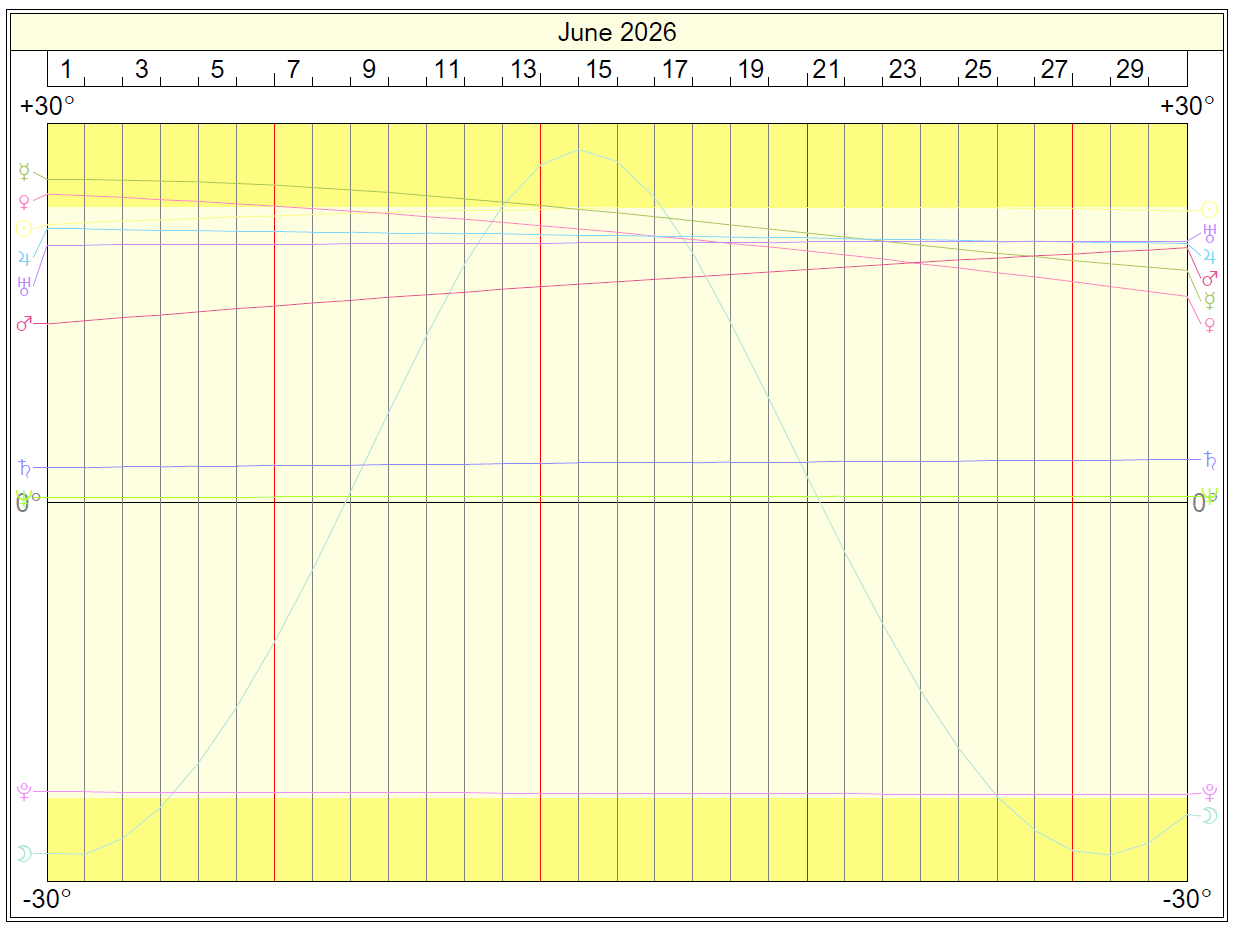
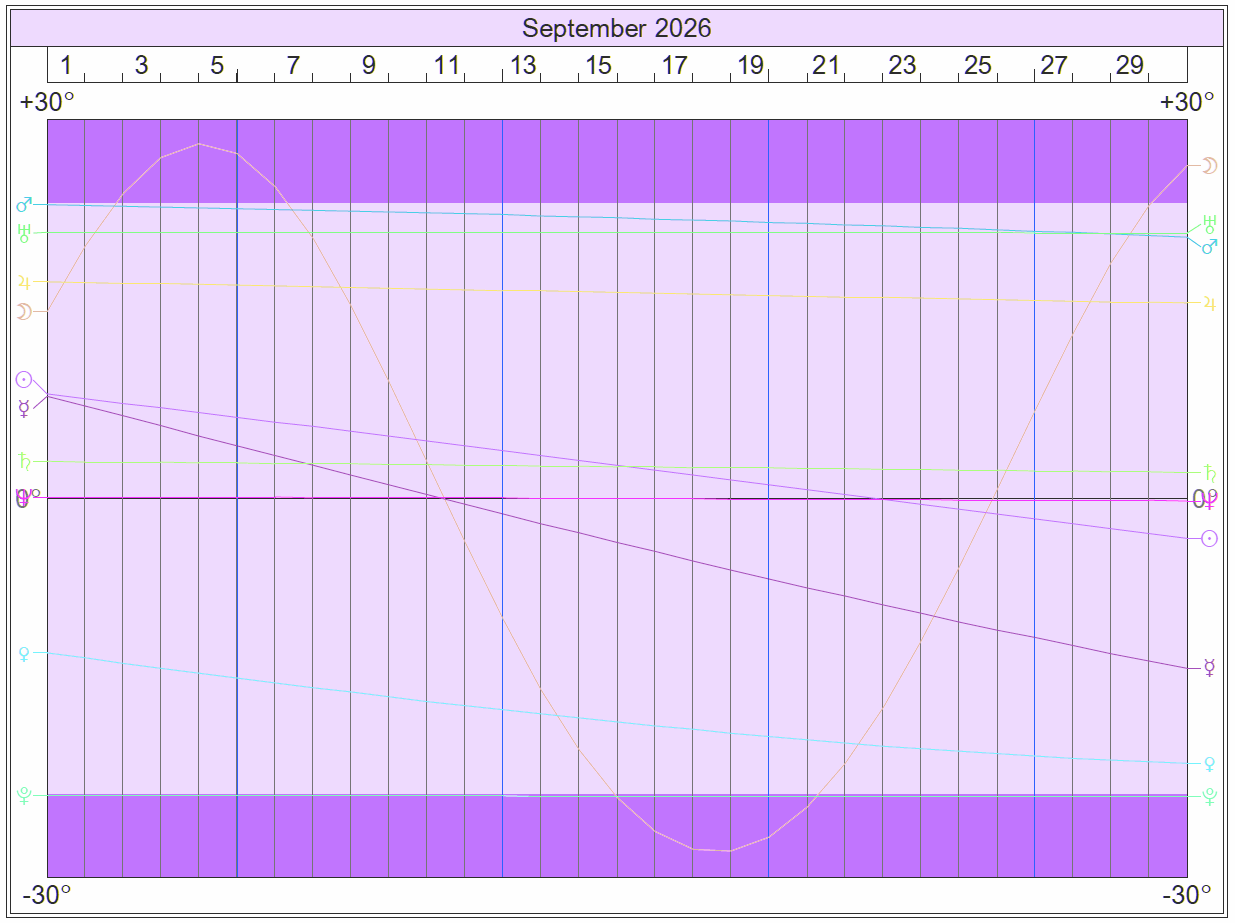
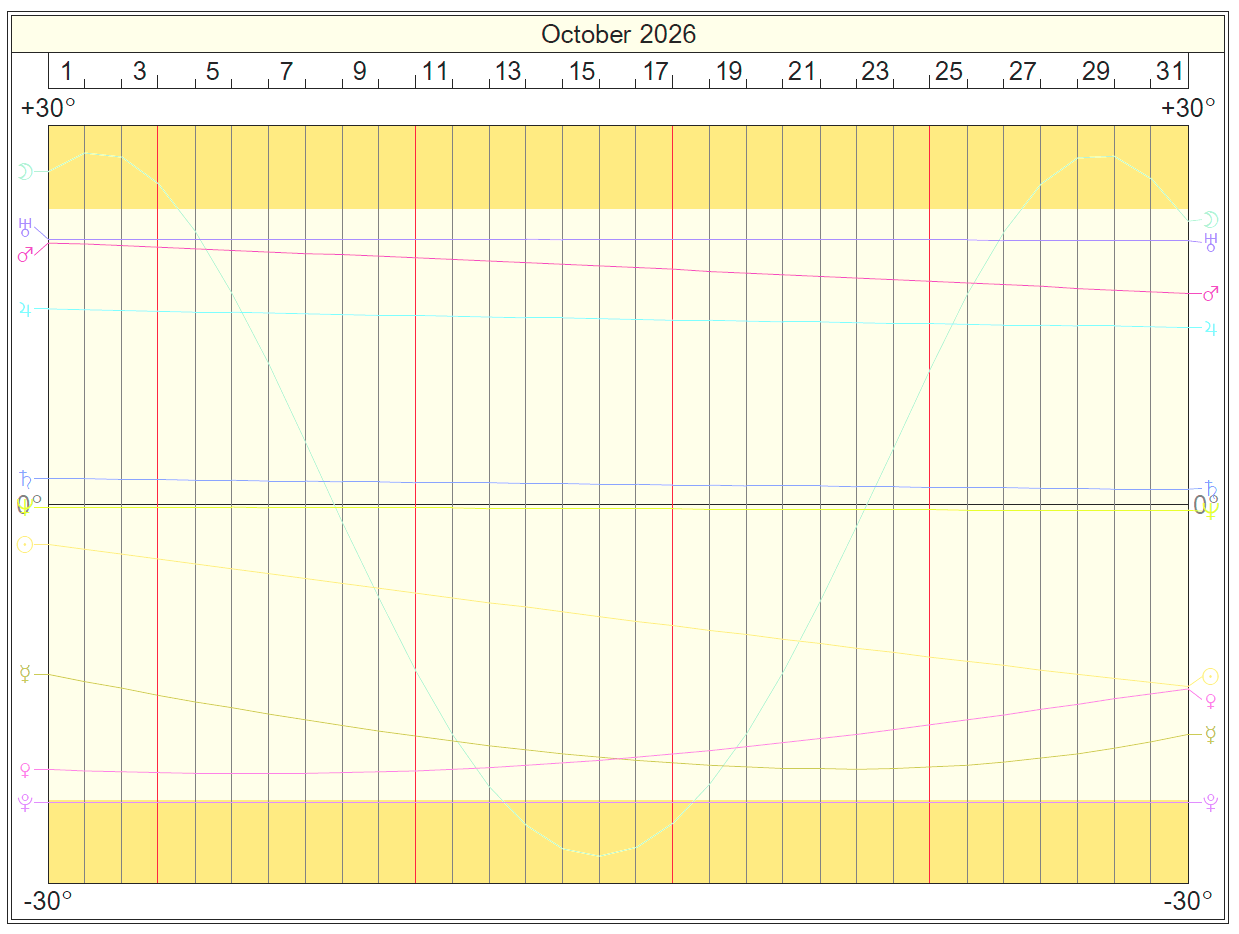
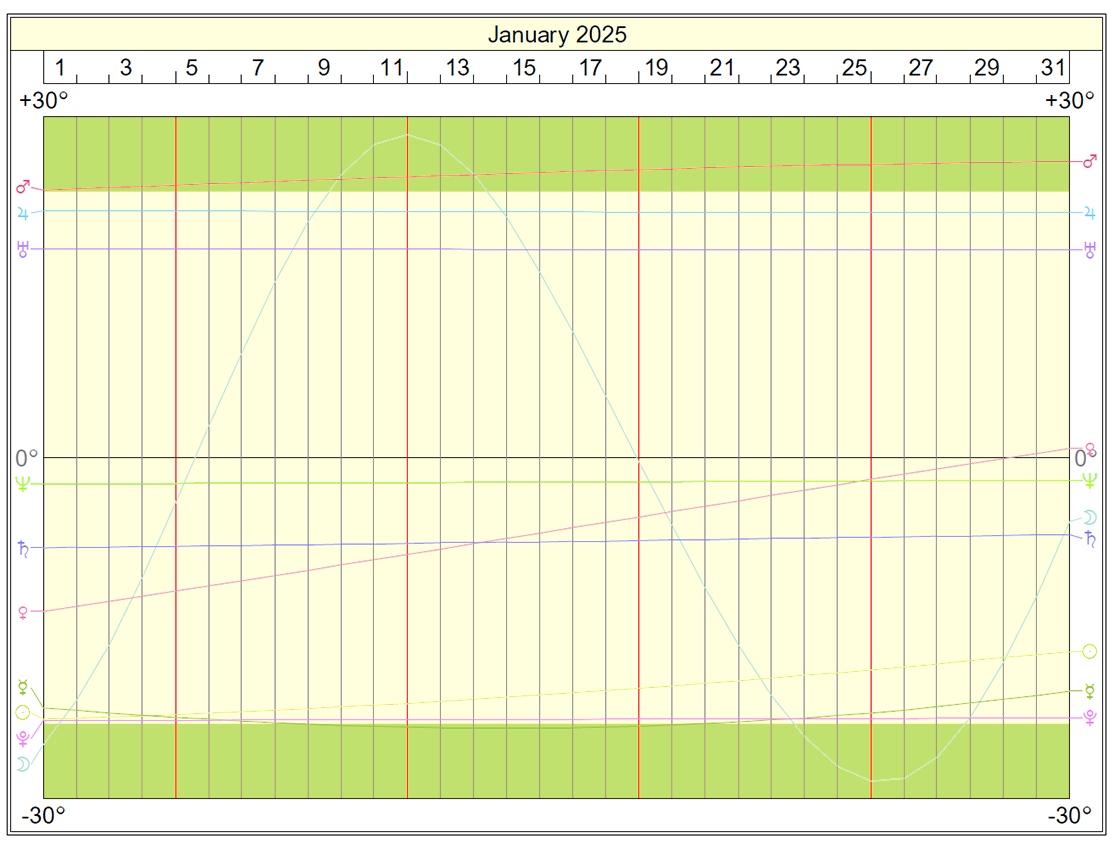
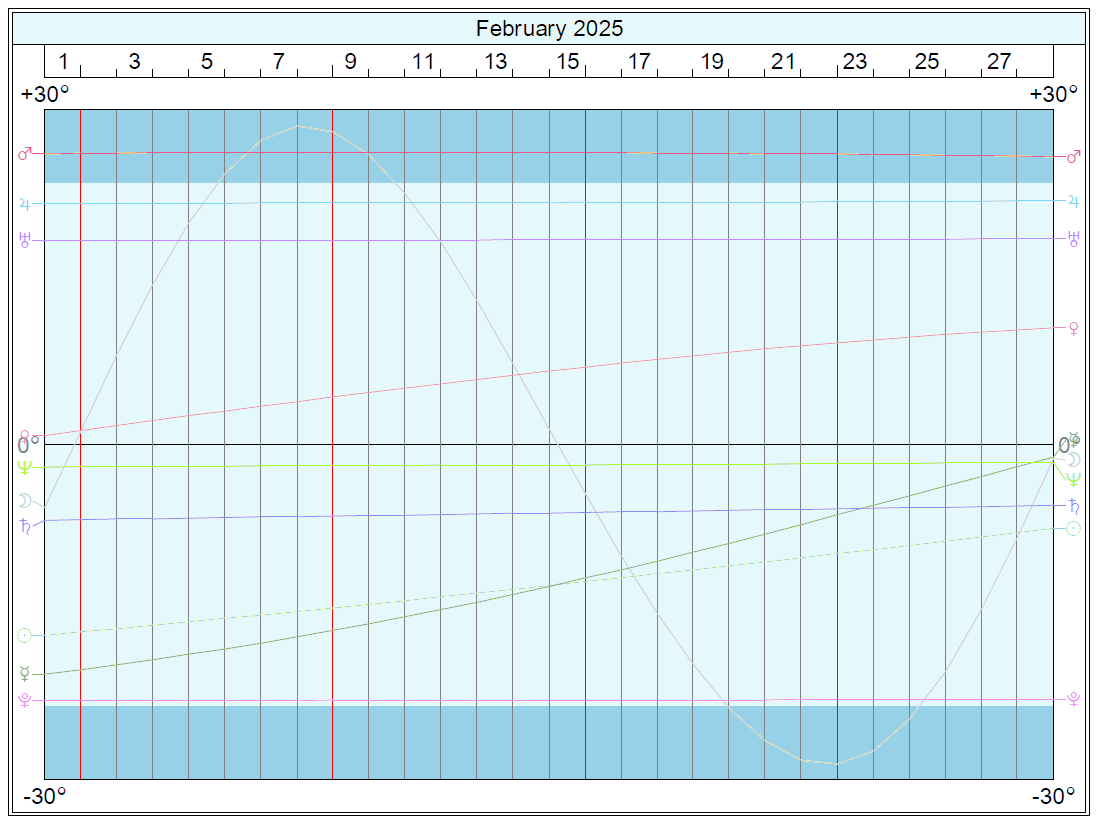
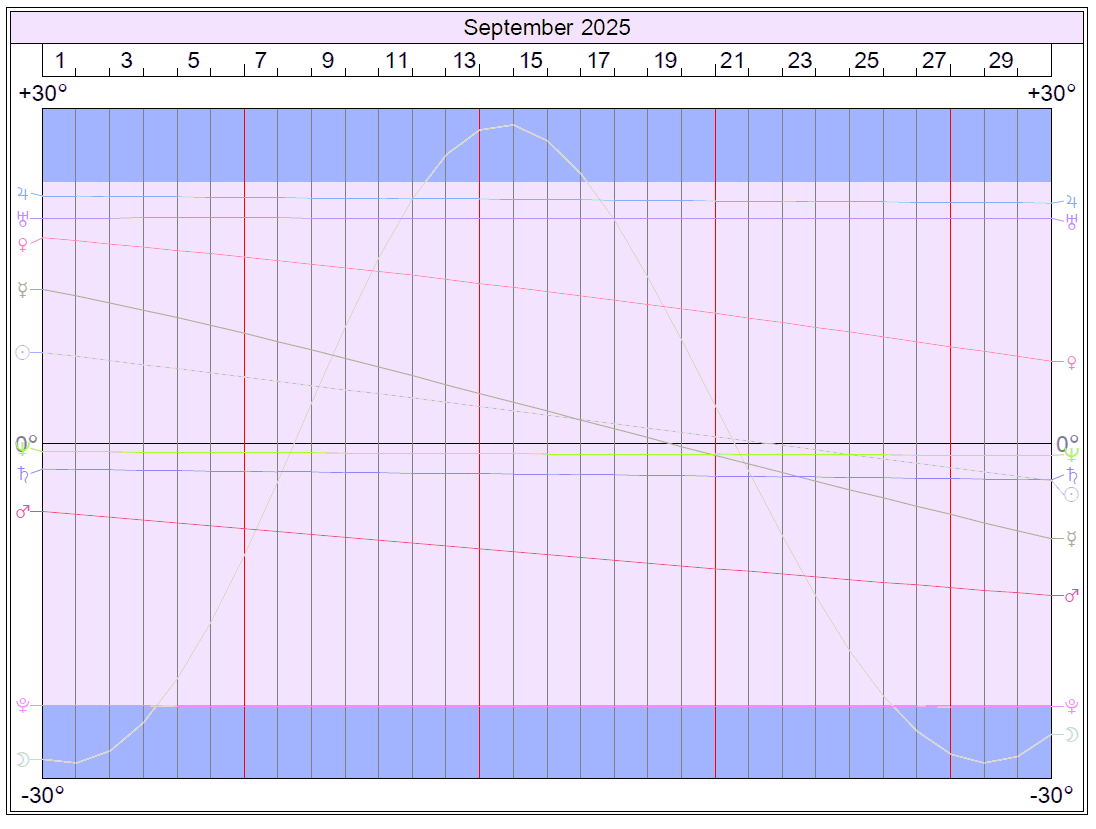
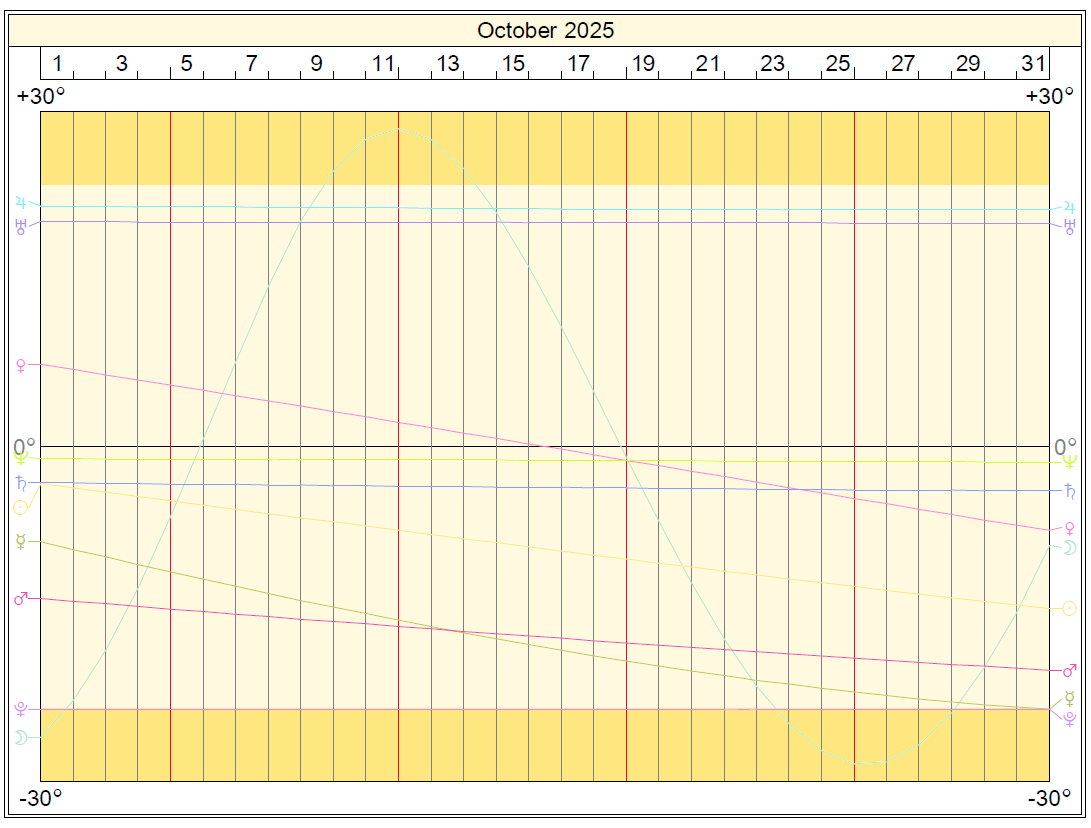
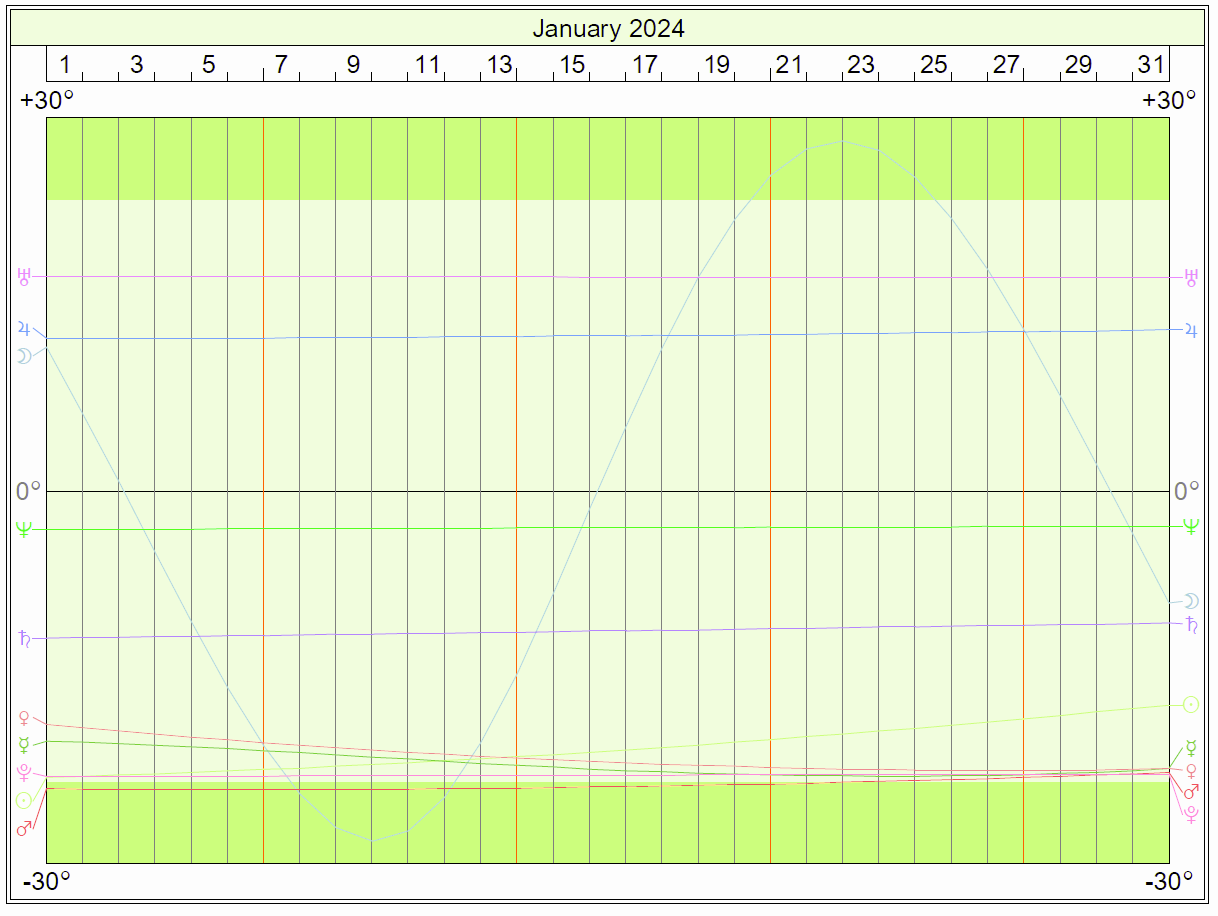
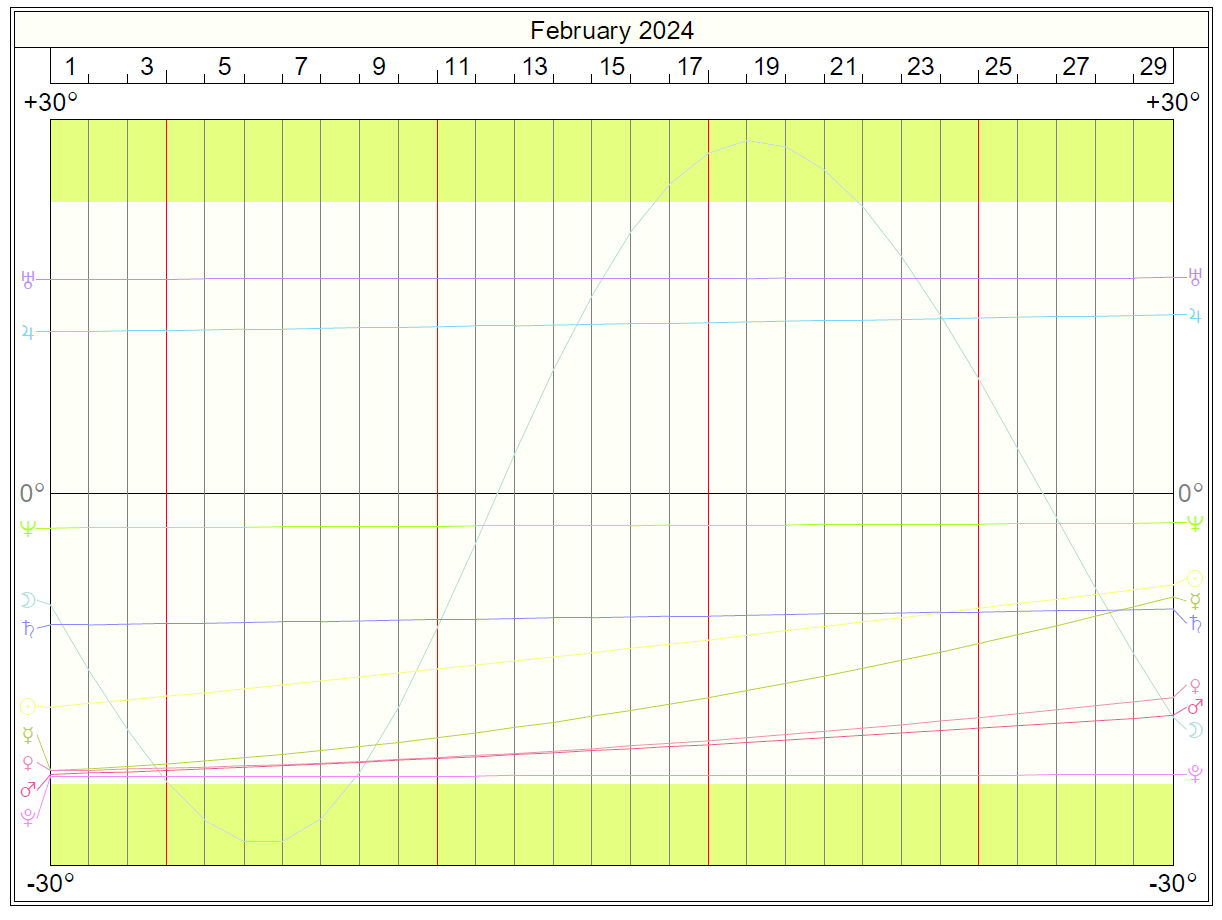
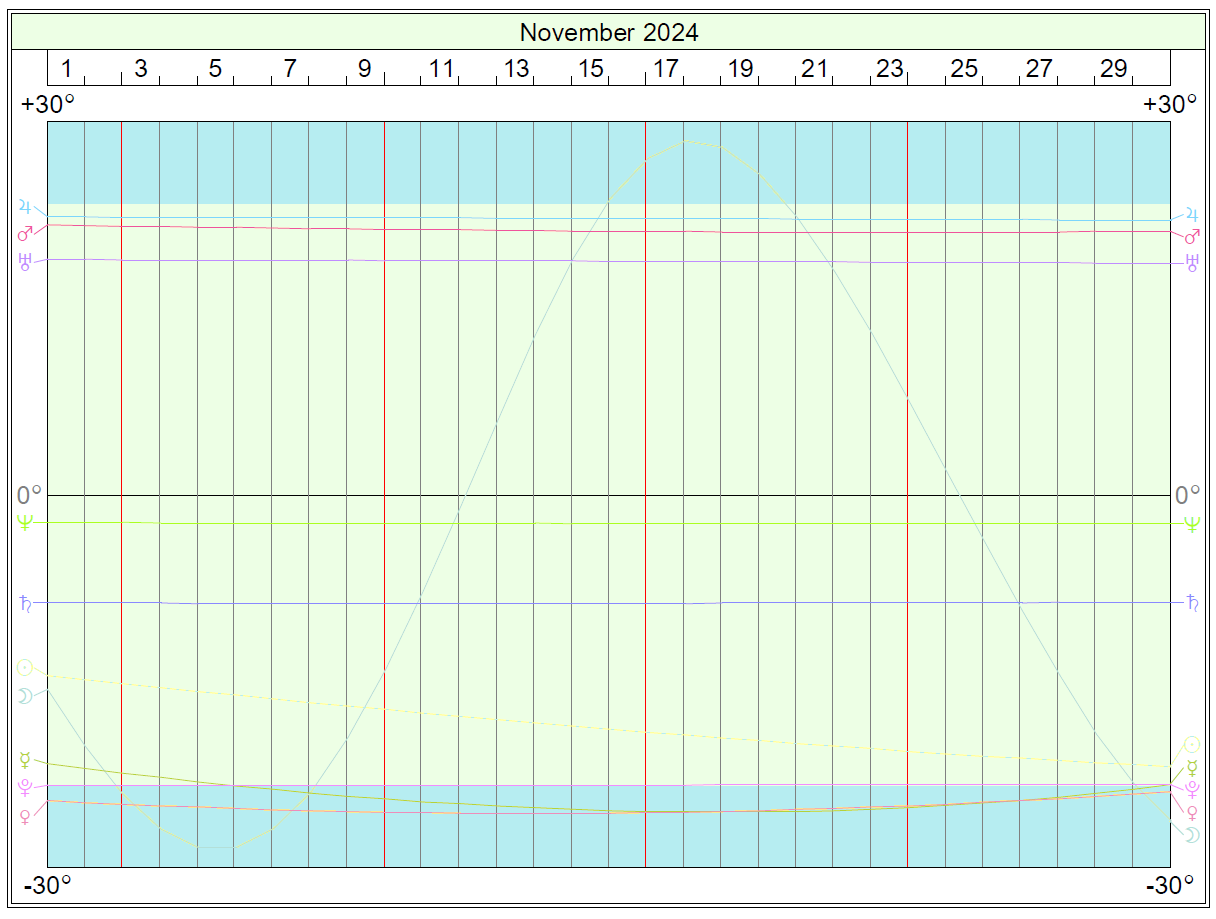
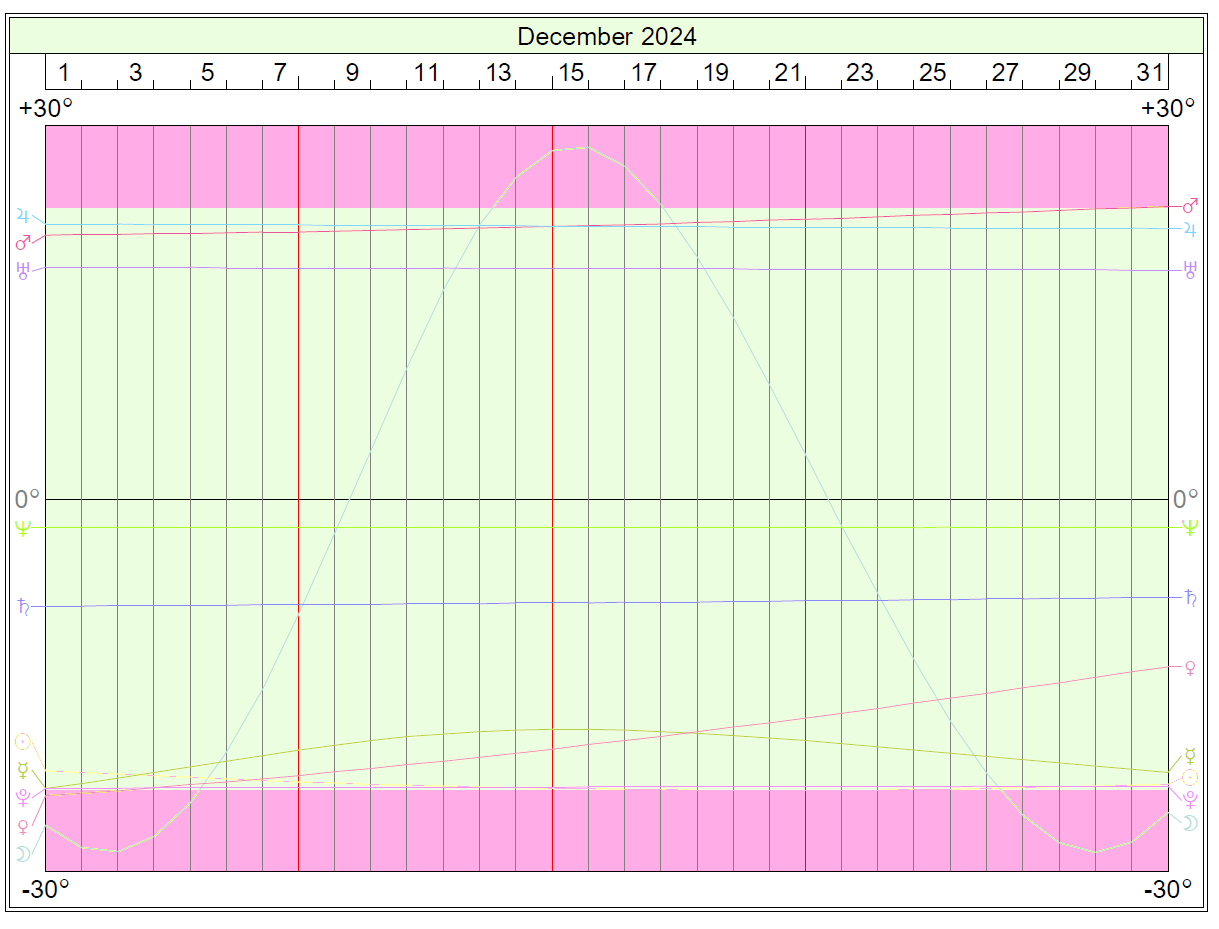
The following graph depicts the planetary declinations of the Sun through Pluto for the given month, with more months below.
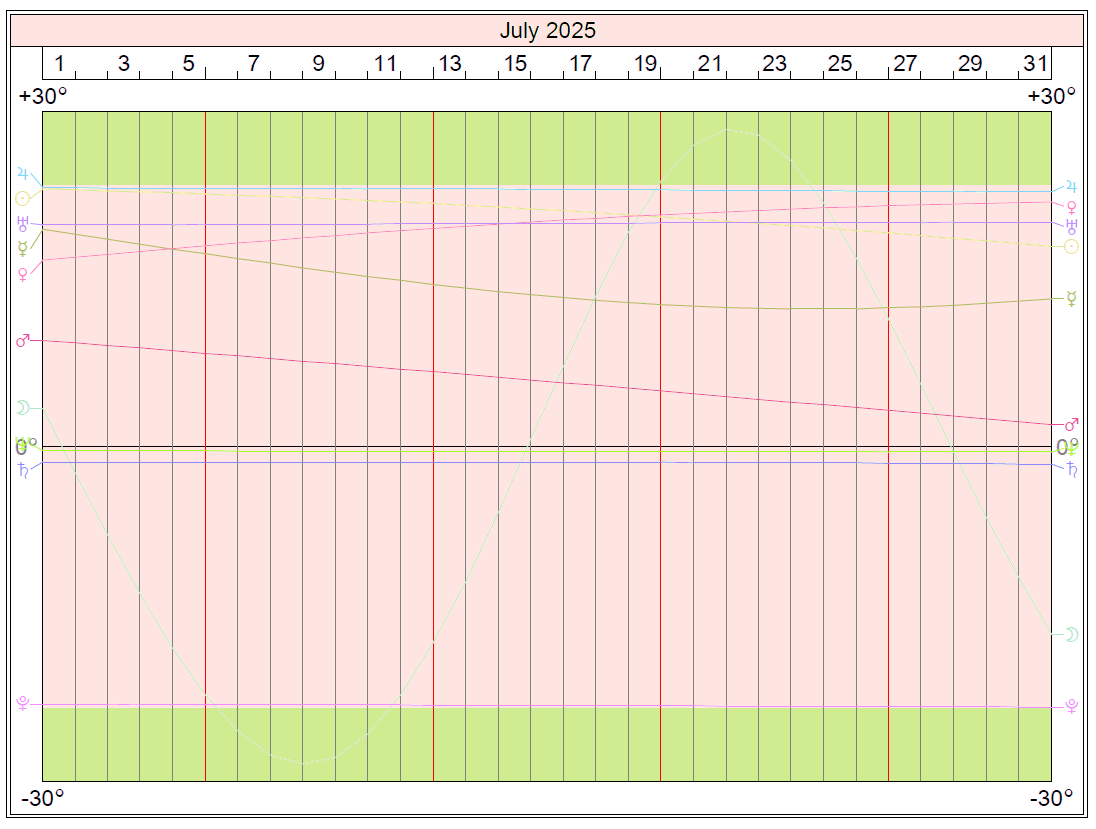
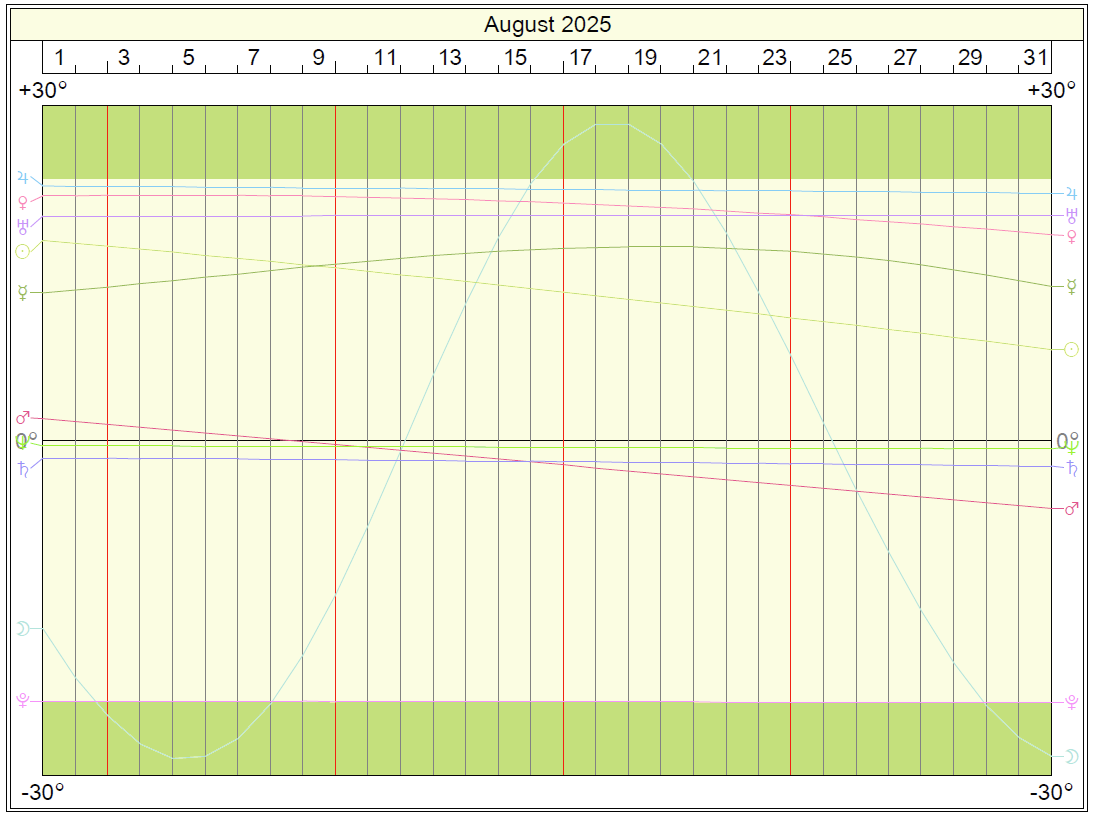
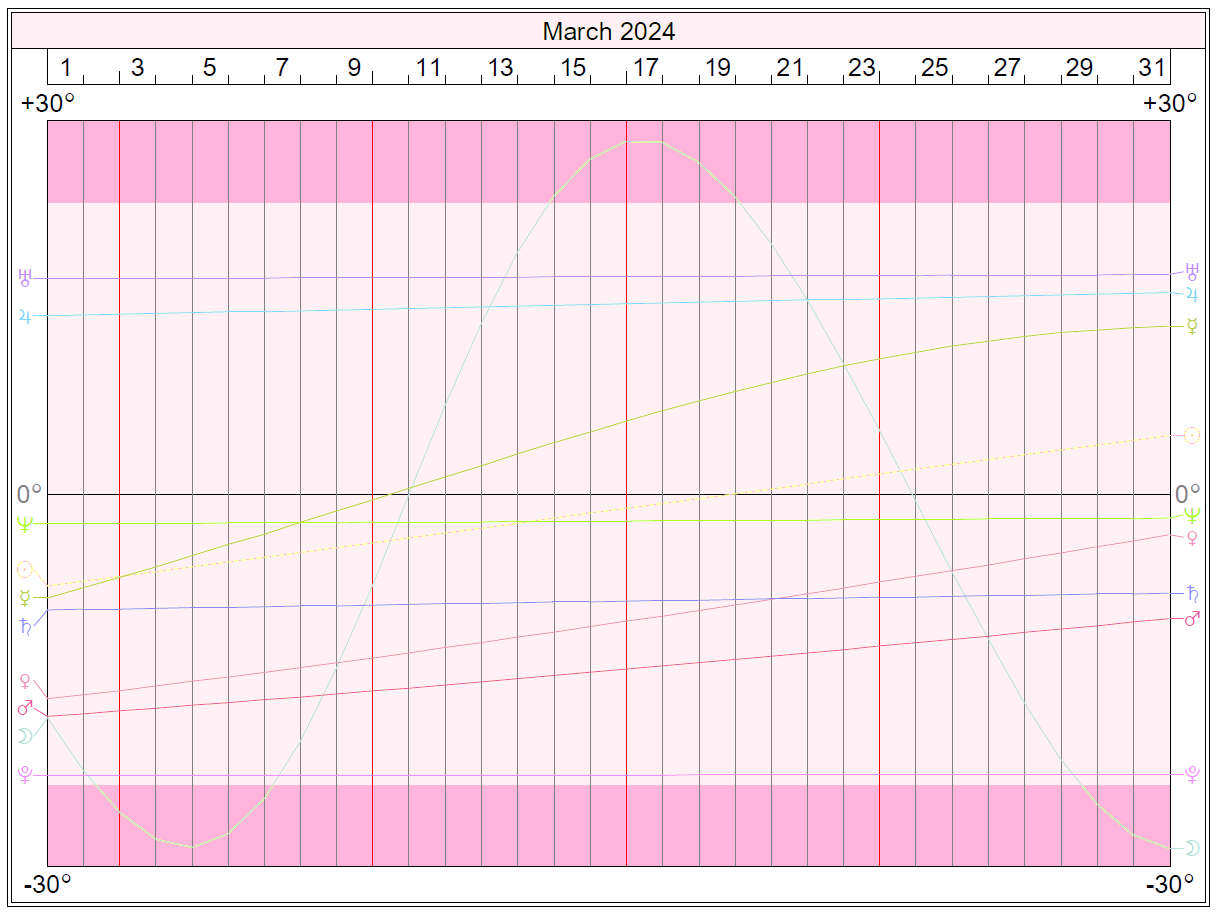
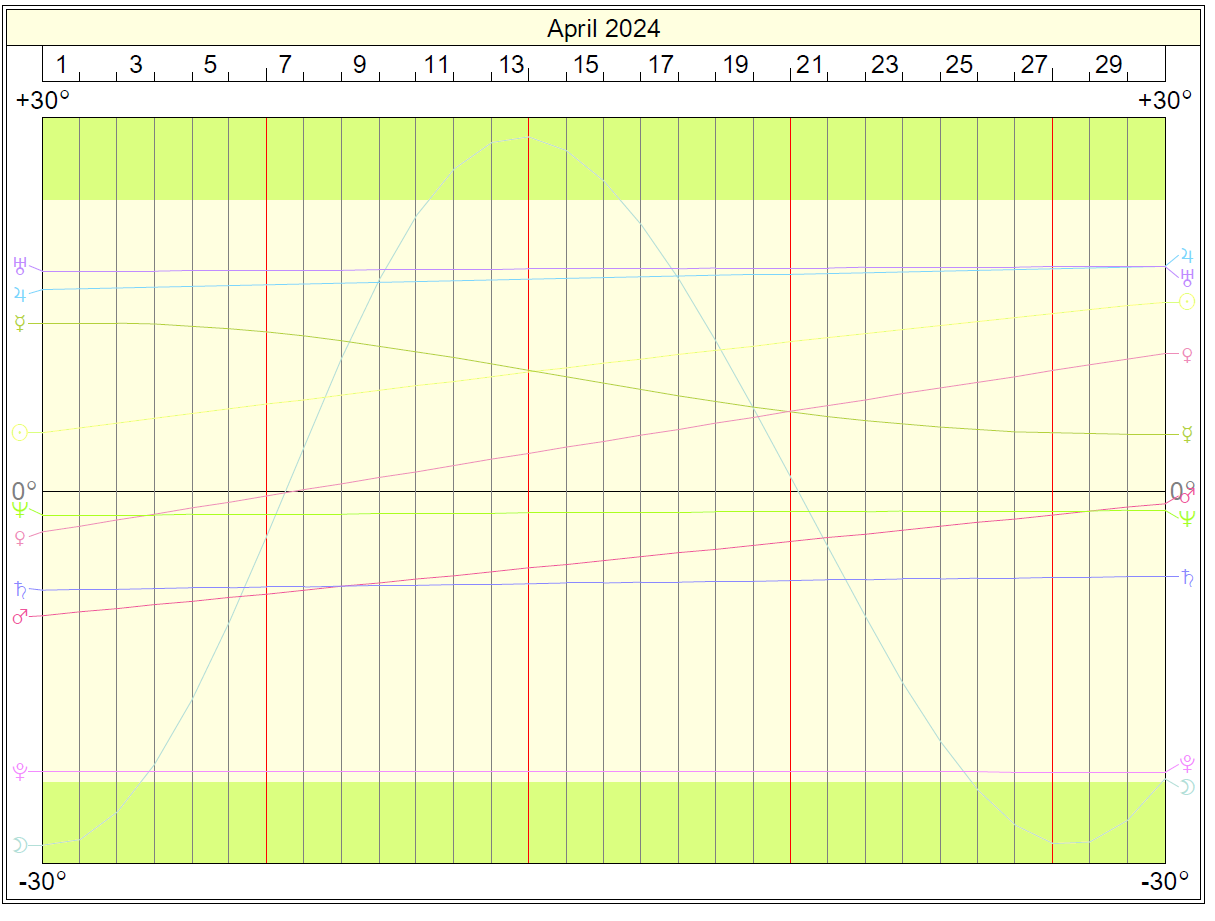
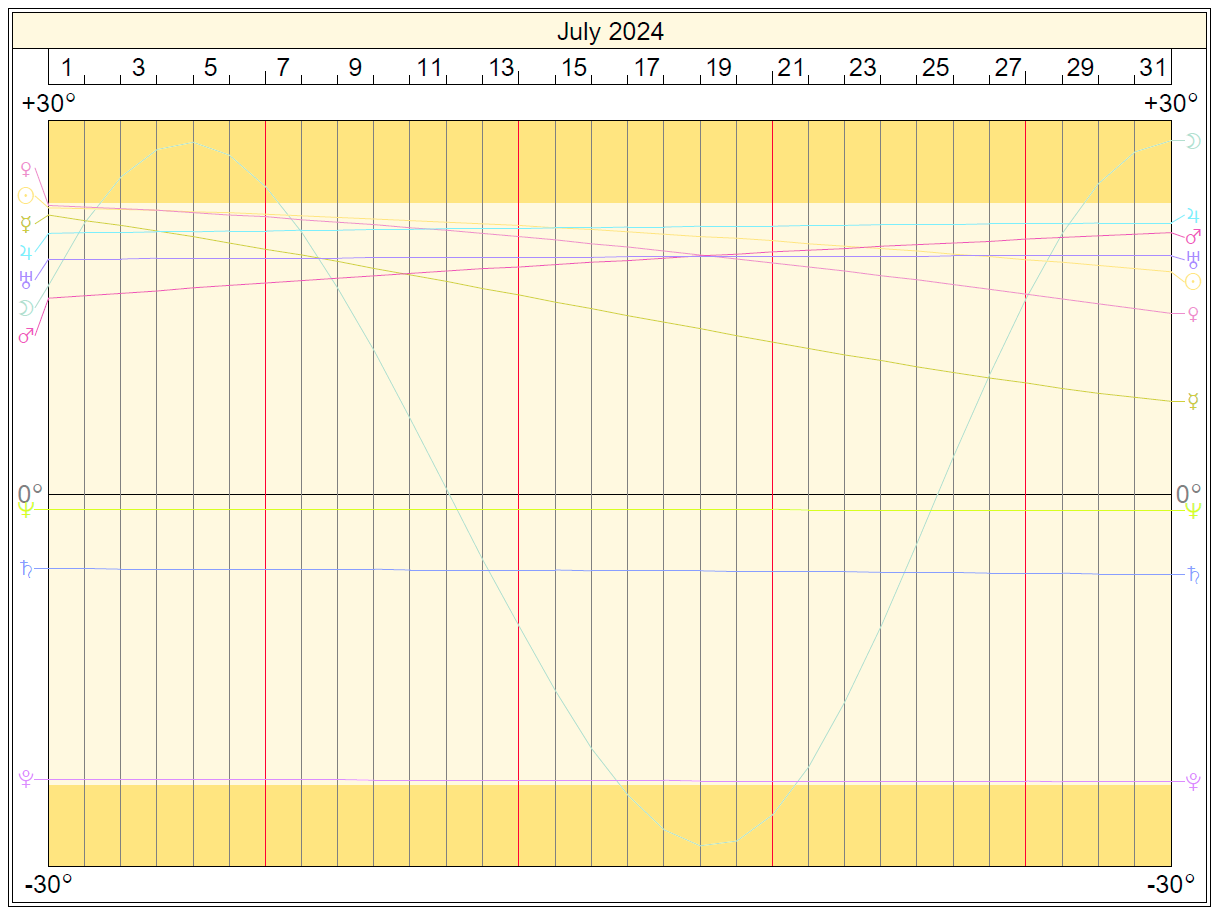
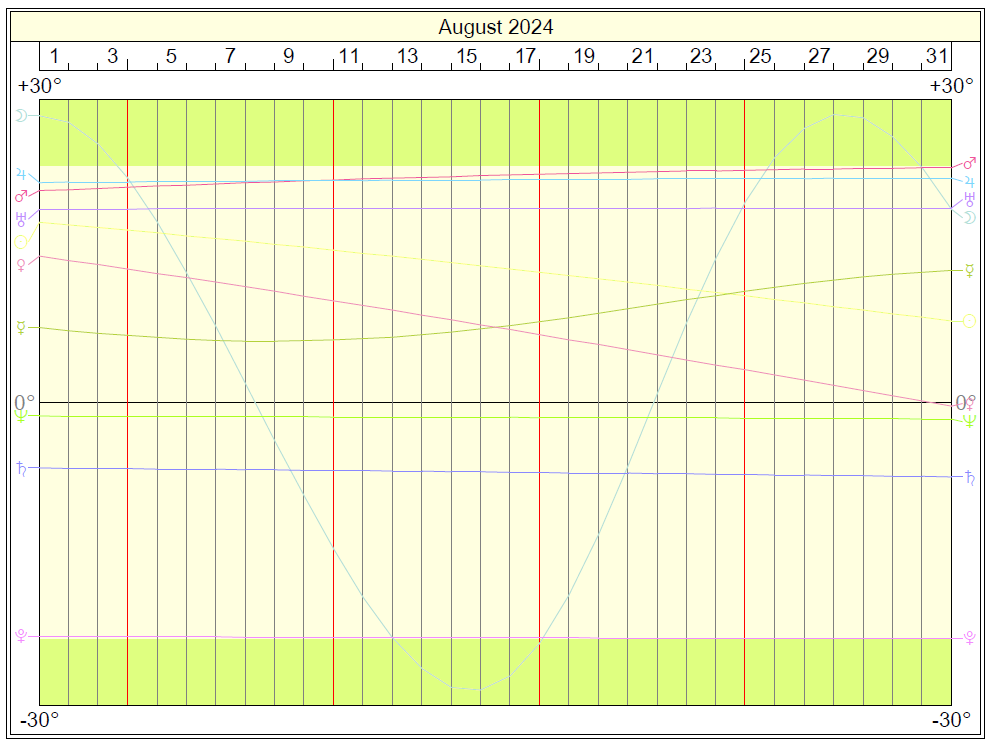
Declinations Graph
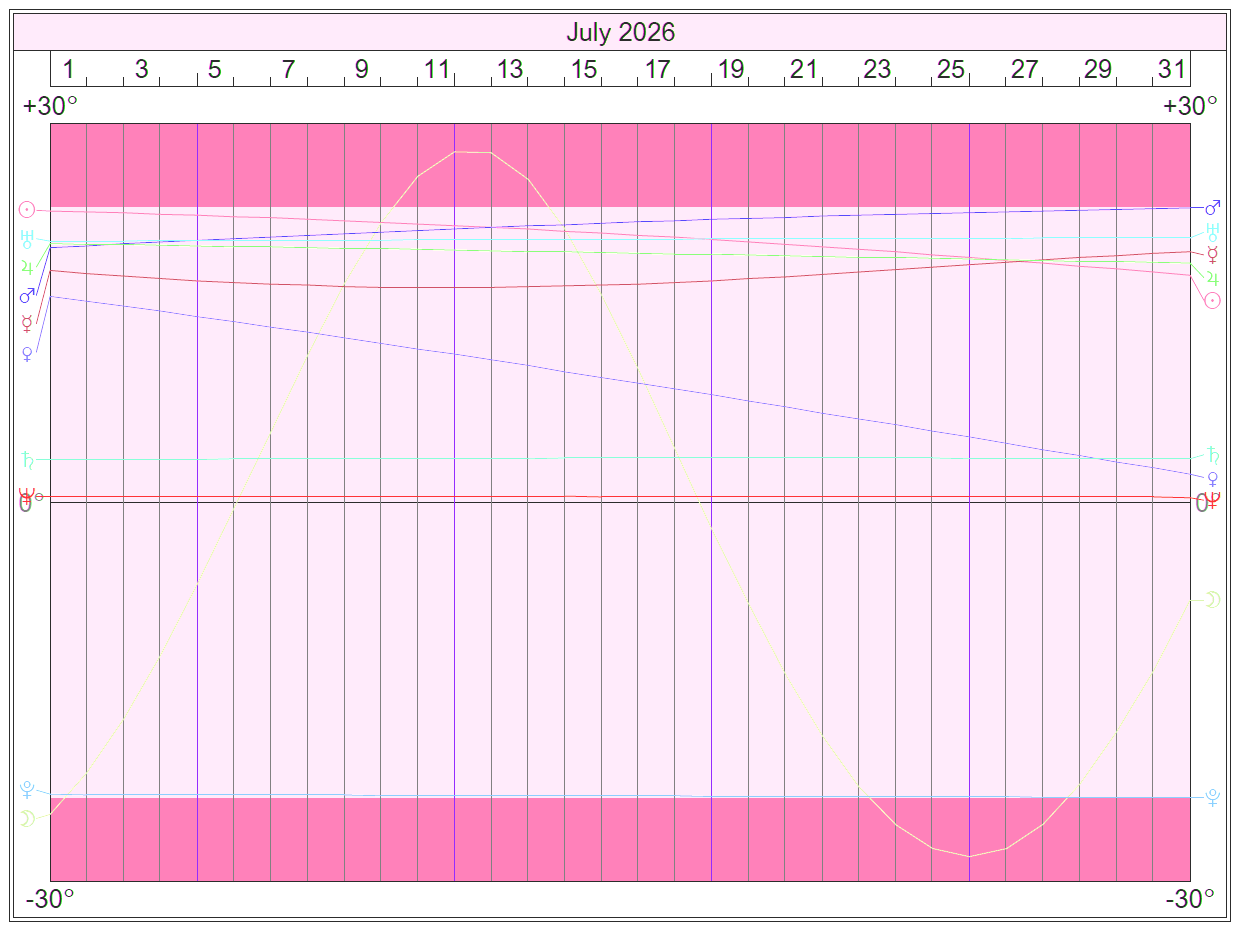
Declinations July 2026
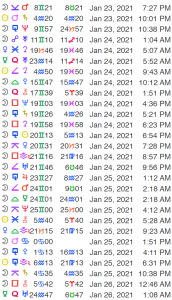
For a listing of Declinations (non-graphical) see the Declinations Ephemeris page.
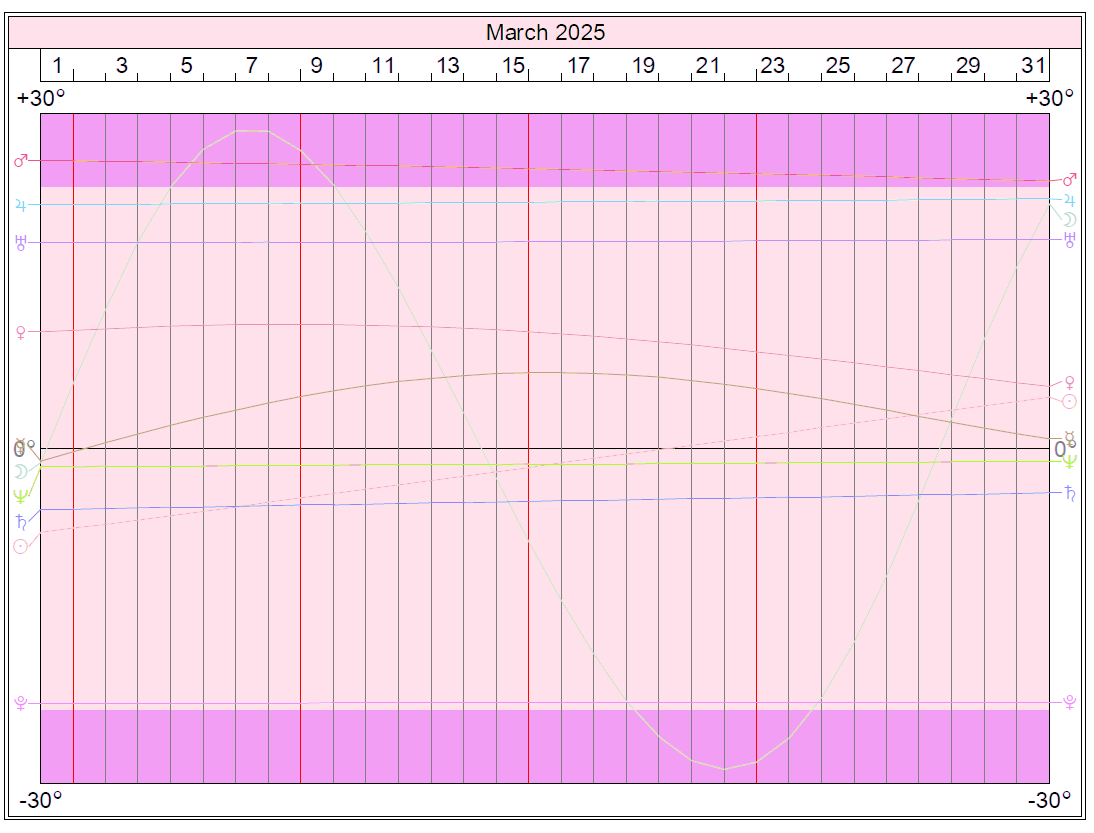
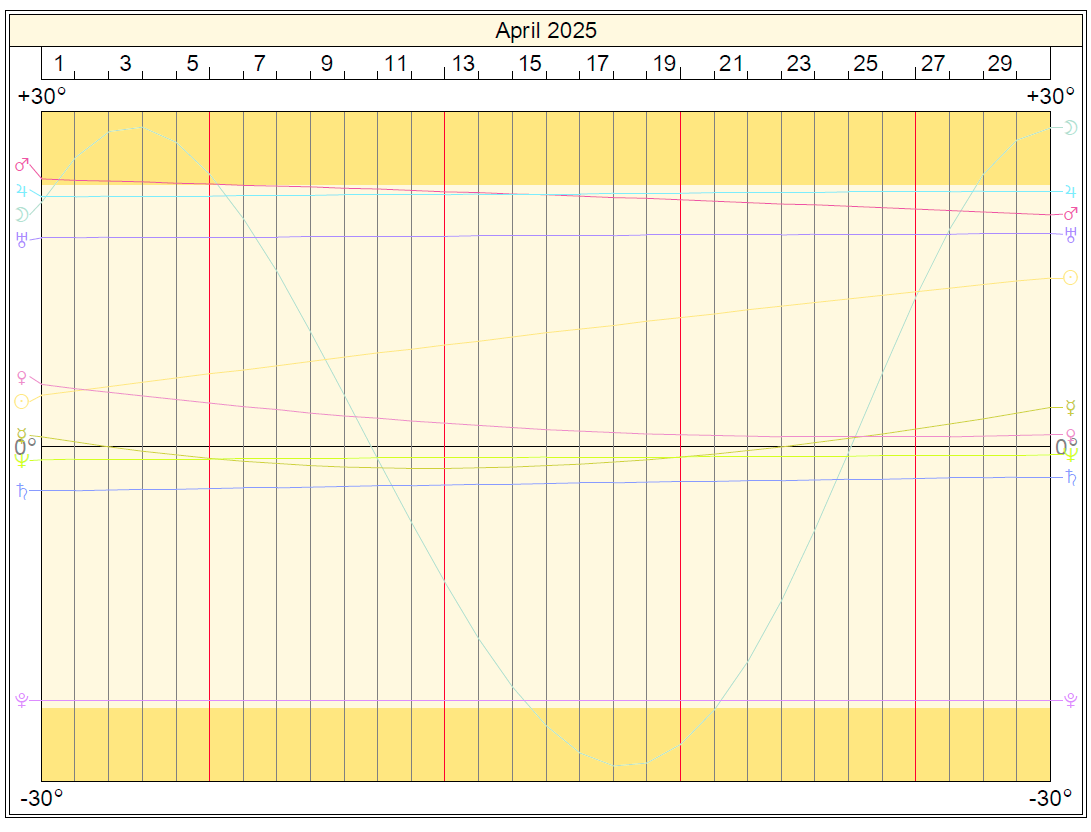
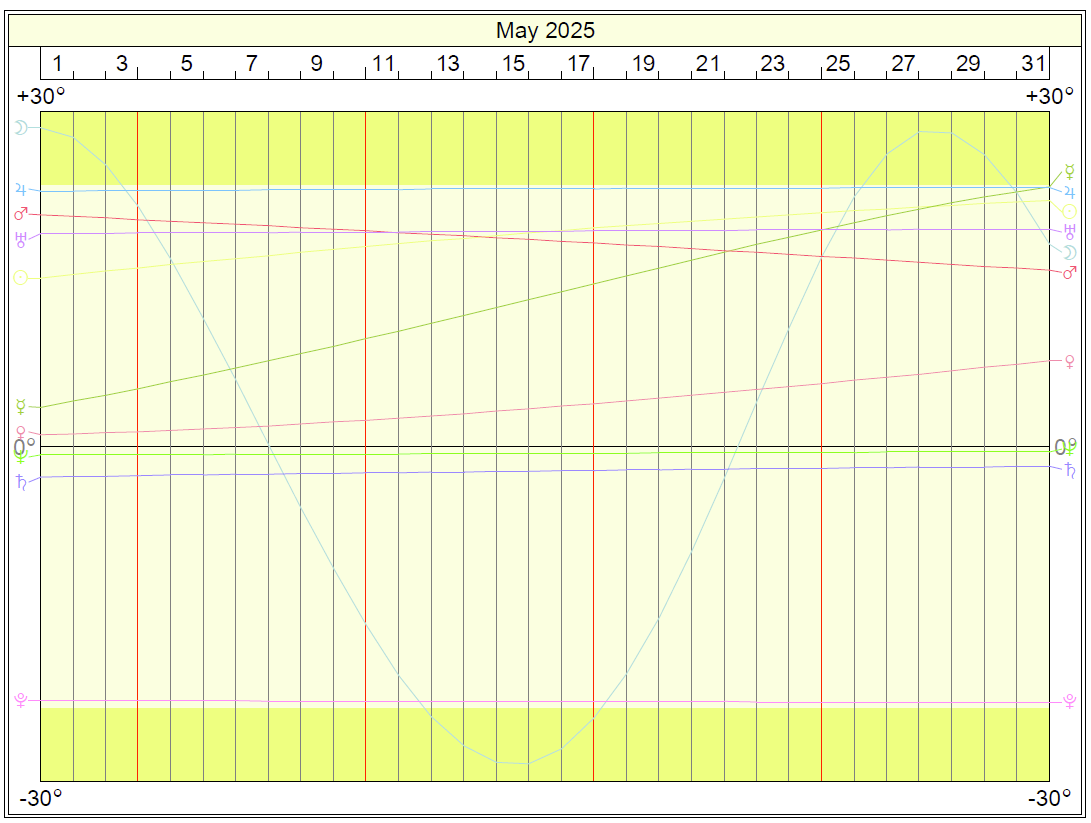
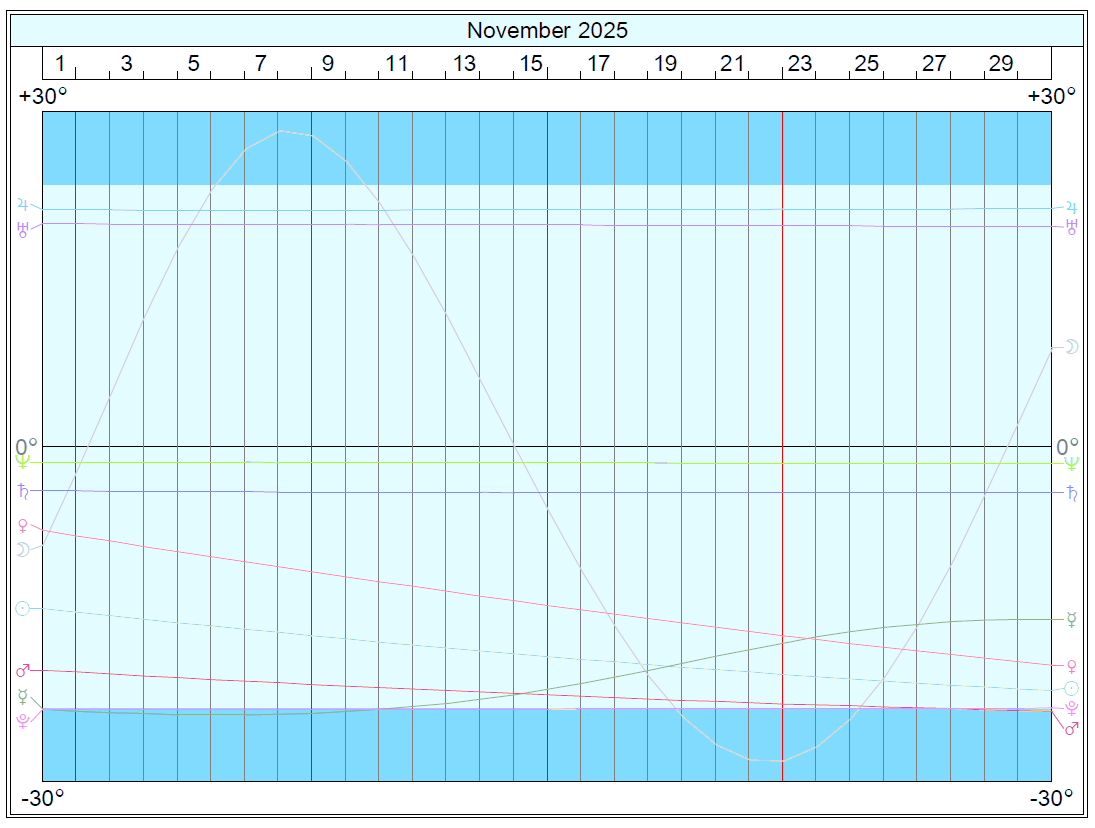
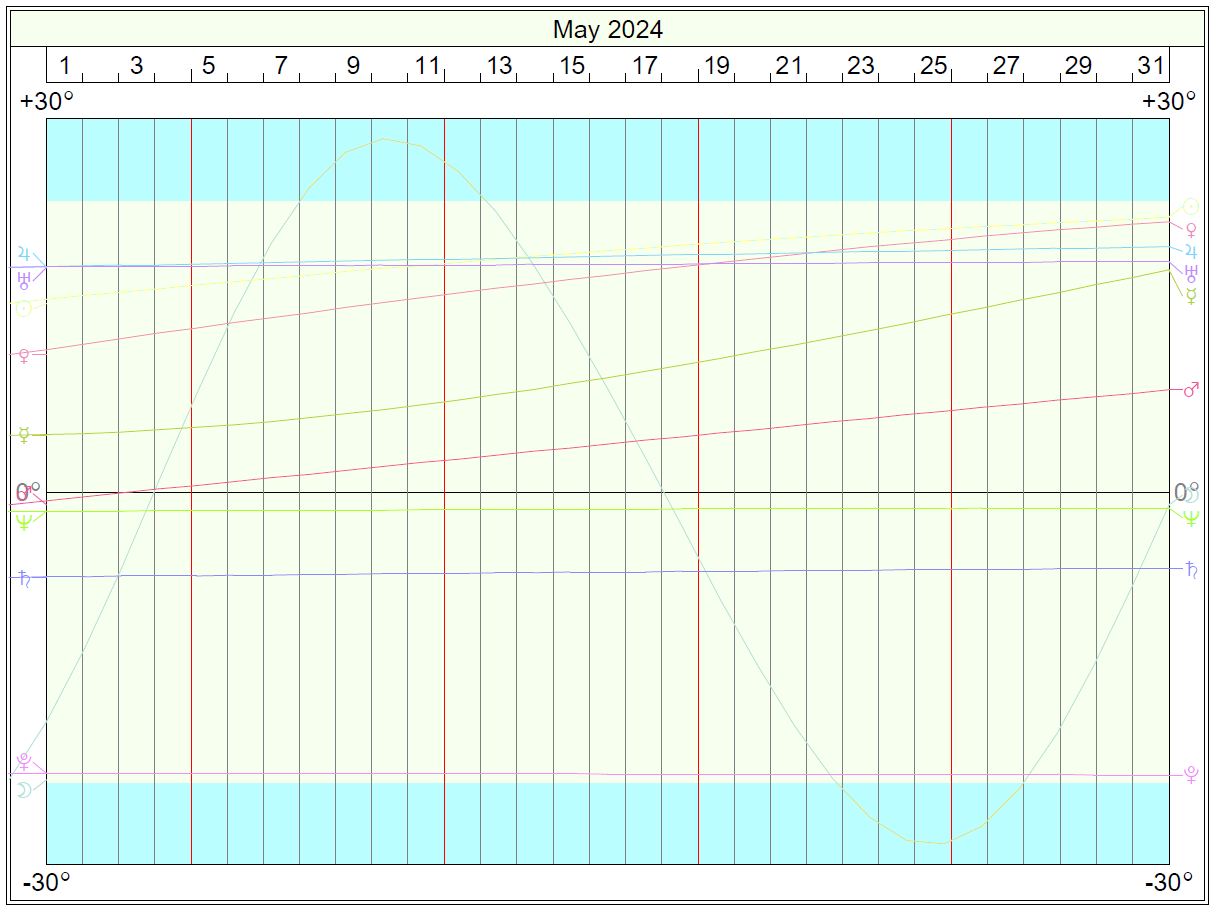
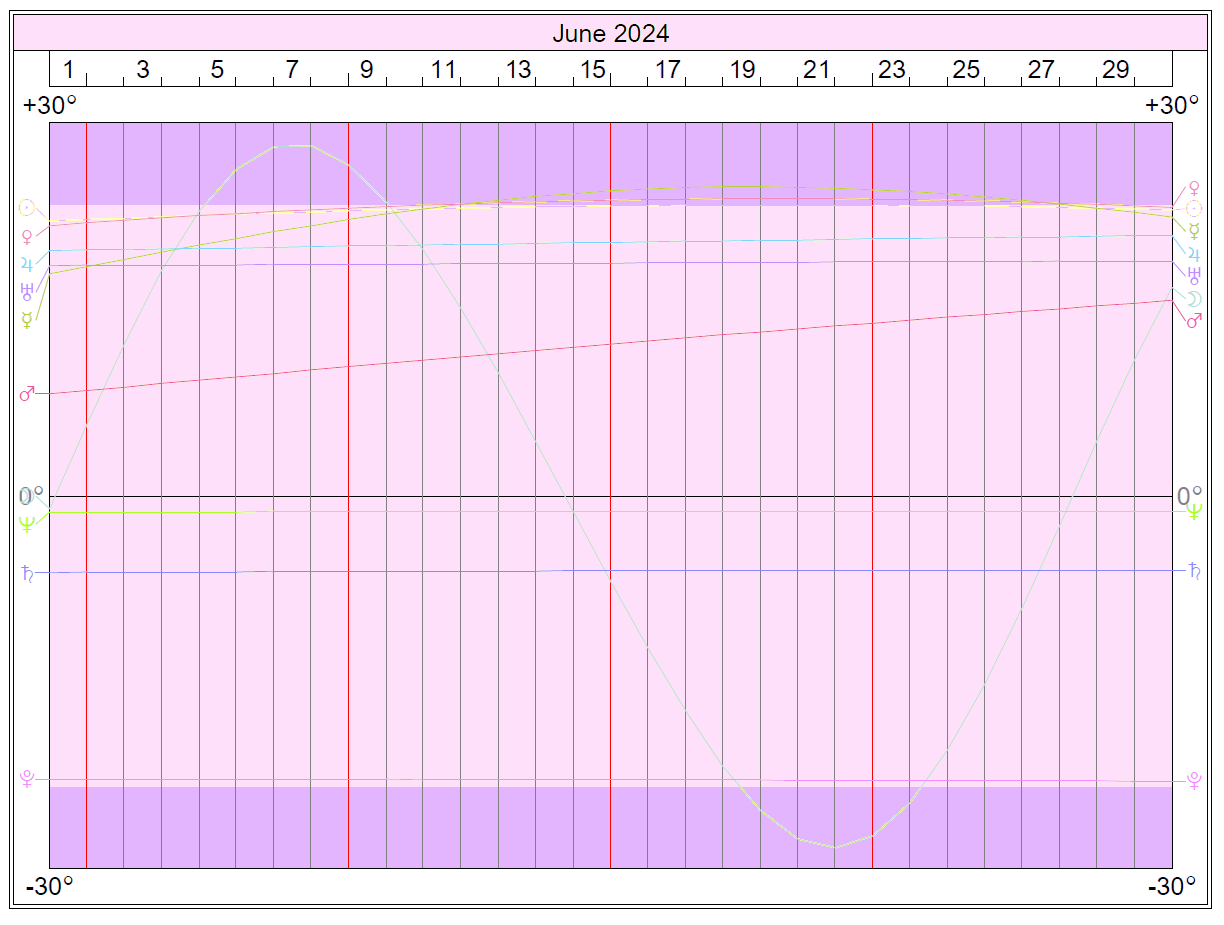
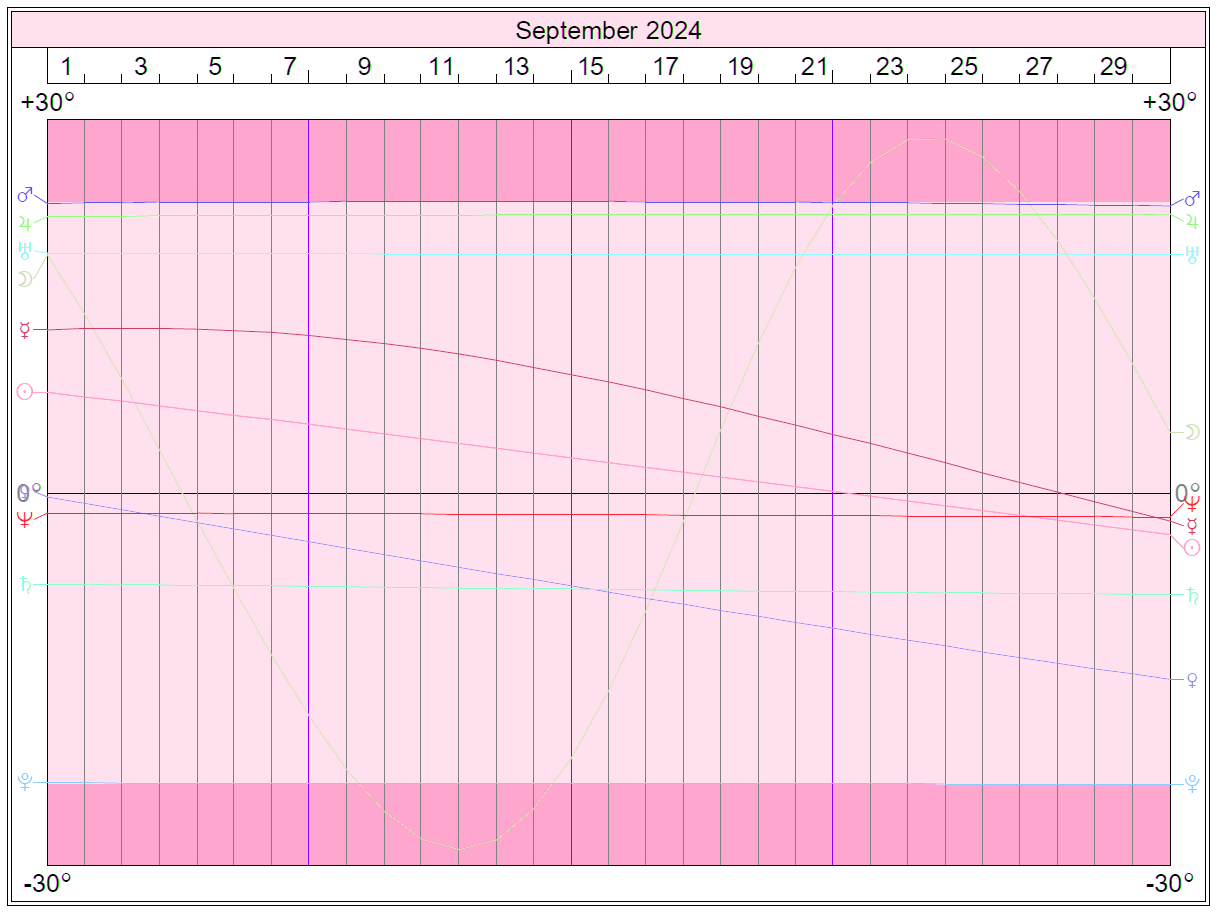
How to read the Declinations Graph:
What Is Declination?
Planets travel in a 360-degree circle around the Sun, but they do not constantly stay at the same latitude. In fact, they continually move up and down. These “ups and downs” are measured as the distance between a planet’s current position and the earth’s equator (as projected into the sky). This measurement is known as declination.
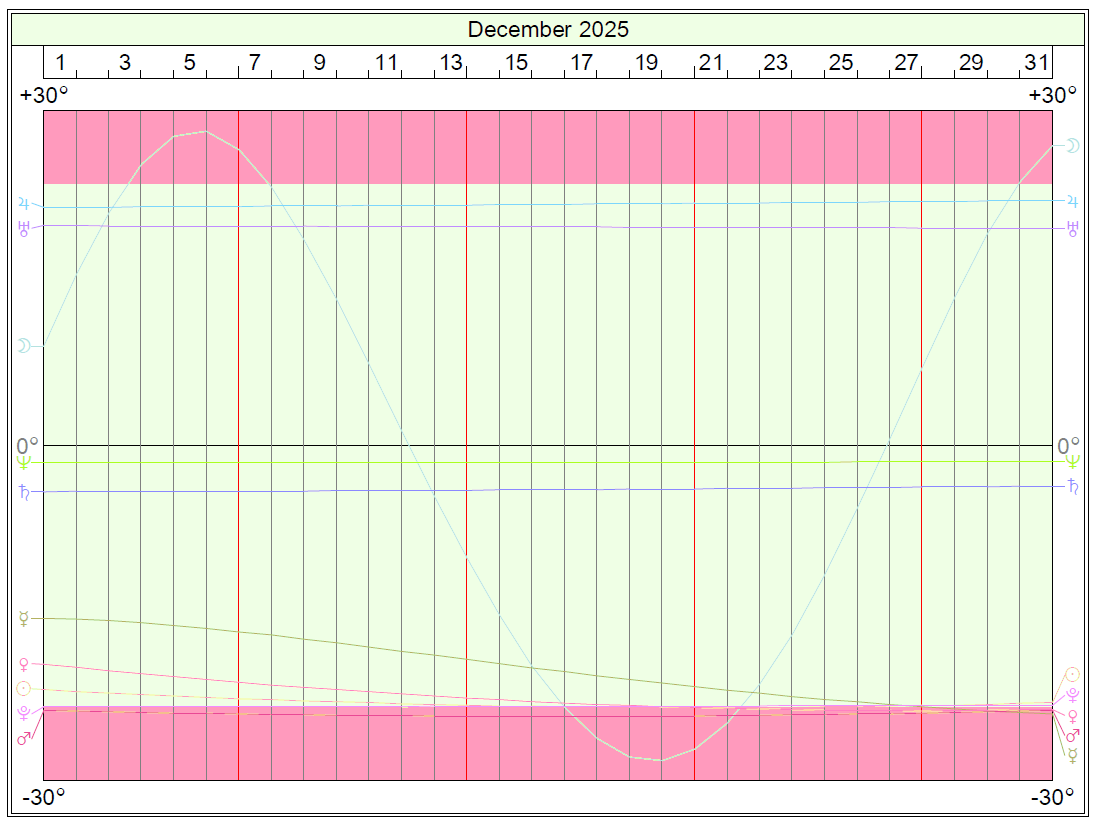
The graphs on this page reveal the declinations for each planet each month.
A good way to see the fluctuations of declination is to follow the Moon since the entire cycle of the Moon occurs every 28 days or so. In each declinations graph, you can see when it makes its maximum, whether up or down, and when it hits the center each month.
How Do I Use The Declination Graph?
The Declination Graph is another way of looking at aspects. To use this graph, just find the planet(s) you are interested in and follow their positions in the graph. When you see planets that are at the same degree and in the same up or down space, they are said to be parallel.
However, if they are at the same degree but one is above and the other is below the middle line (celestial equator), they are considered to be contra-parallel.
These aspects bear some similarity to the conjunction and the opposition aspects.
- Parallels exist when there is a conjunction. Its meaning will be determined by the planets involved and the houses and signs that they occupy. When two planets are conjunct and parallel, they share the same celestial latitude and degree.
- Contra-Parallels exist when there is an opposition; like the parallel, its meaning depends on the planets and their house positions. When two planets are opposed and parallel, that means they share the same celestial latitude, as well as opposing degrees.
There is a special time when the planet is at Zero–when they are neither above nor below the celestial equator (the middle line in the graph). The planet is especially strong and the principles of that planet are emphasized at these times!
You might also be interested in Out of Bounds planets (when planets exceed 23 degrees and 27 minutes of declination, either North or South).
More Months – 2026:
-
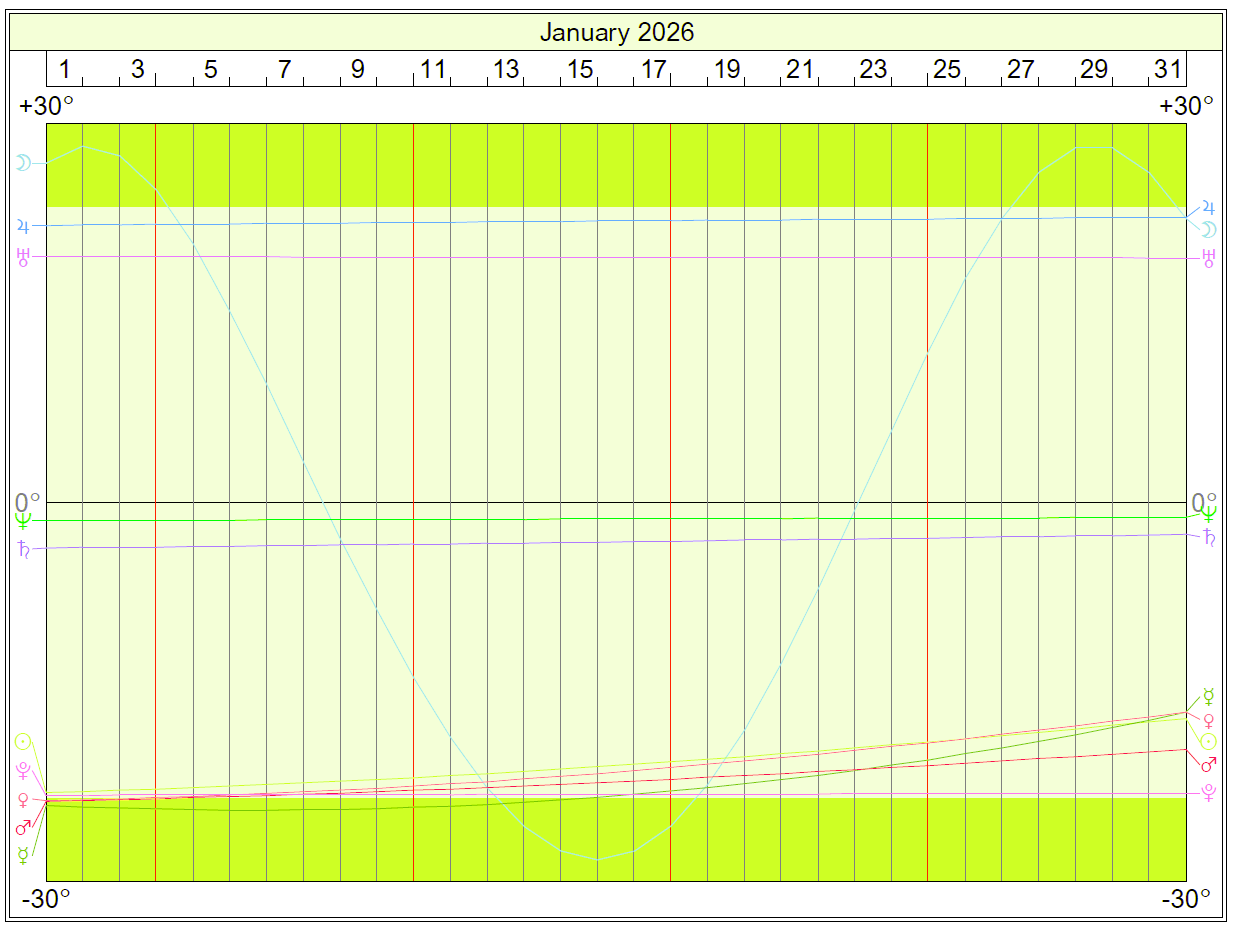
- Declinations January 2026
-
- Declinations February 2026
-
- Declinations March 2026
-
- Declinations April 2026
-
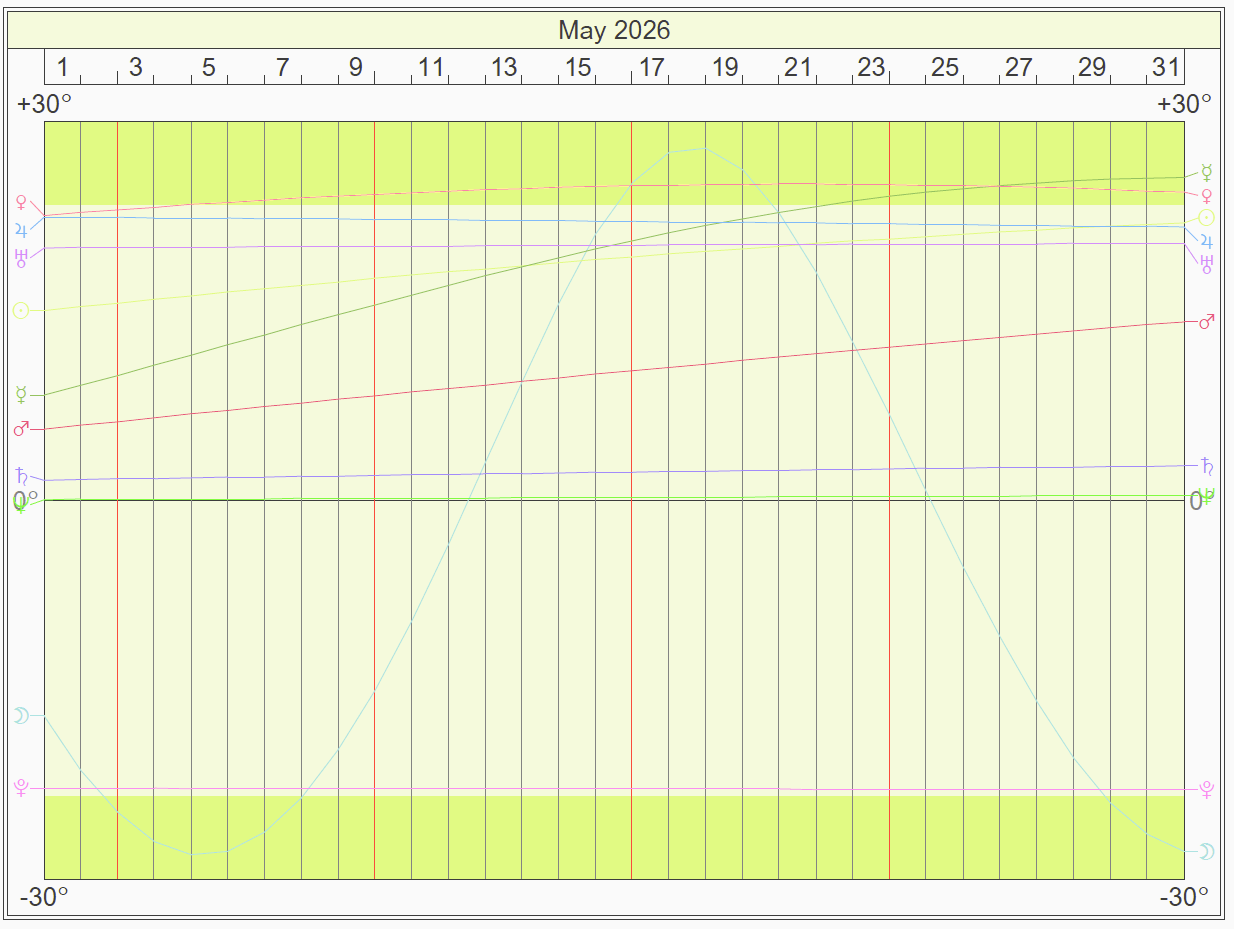
- Declinations May 2026
-
- Declinations June 2026
-
- Declinations July 2026
-
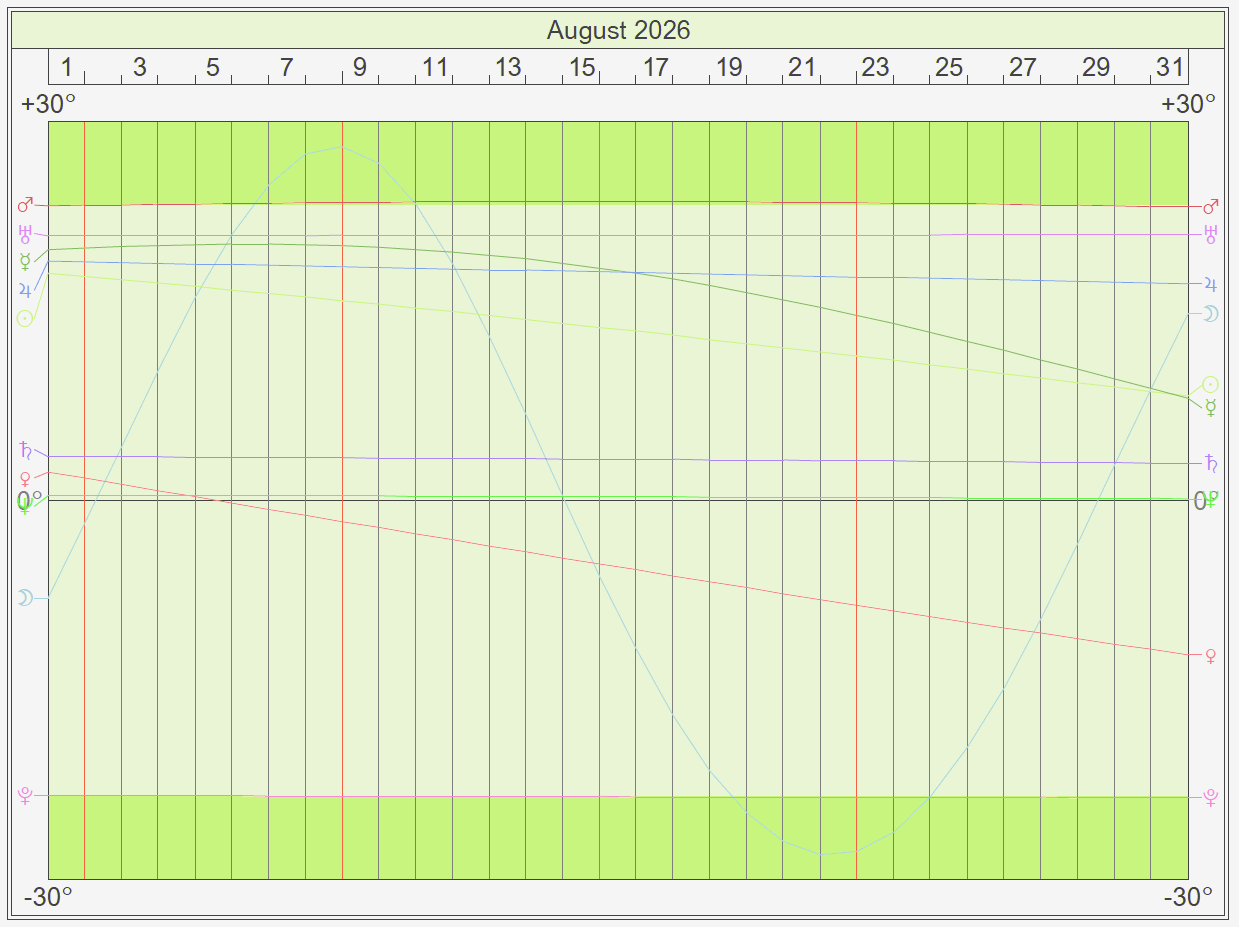
- Declinations August 2026
-
- Declinations September 2026
-
- Declinations October 2026
-
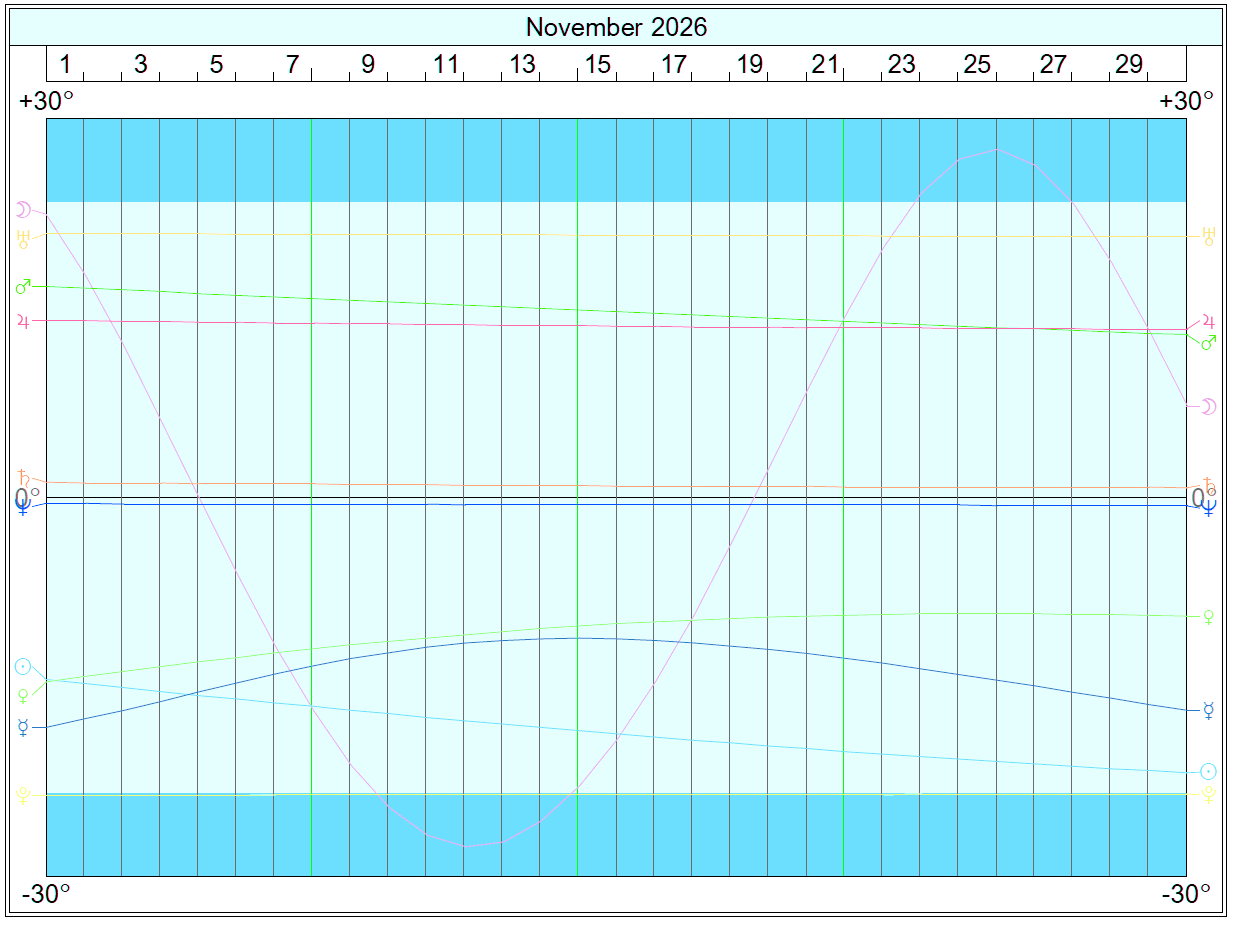
- Declinations November 2026
-
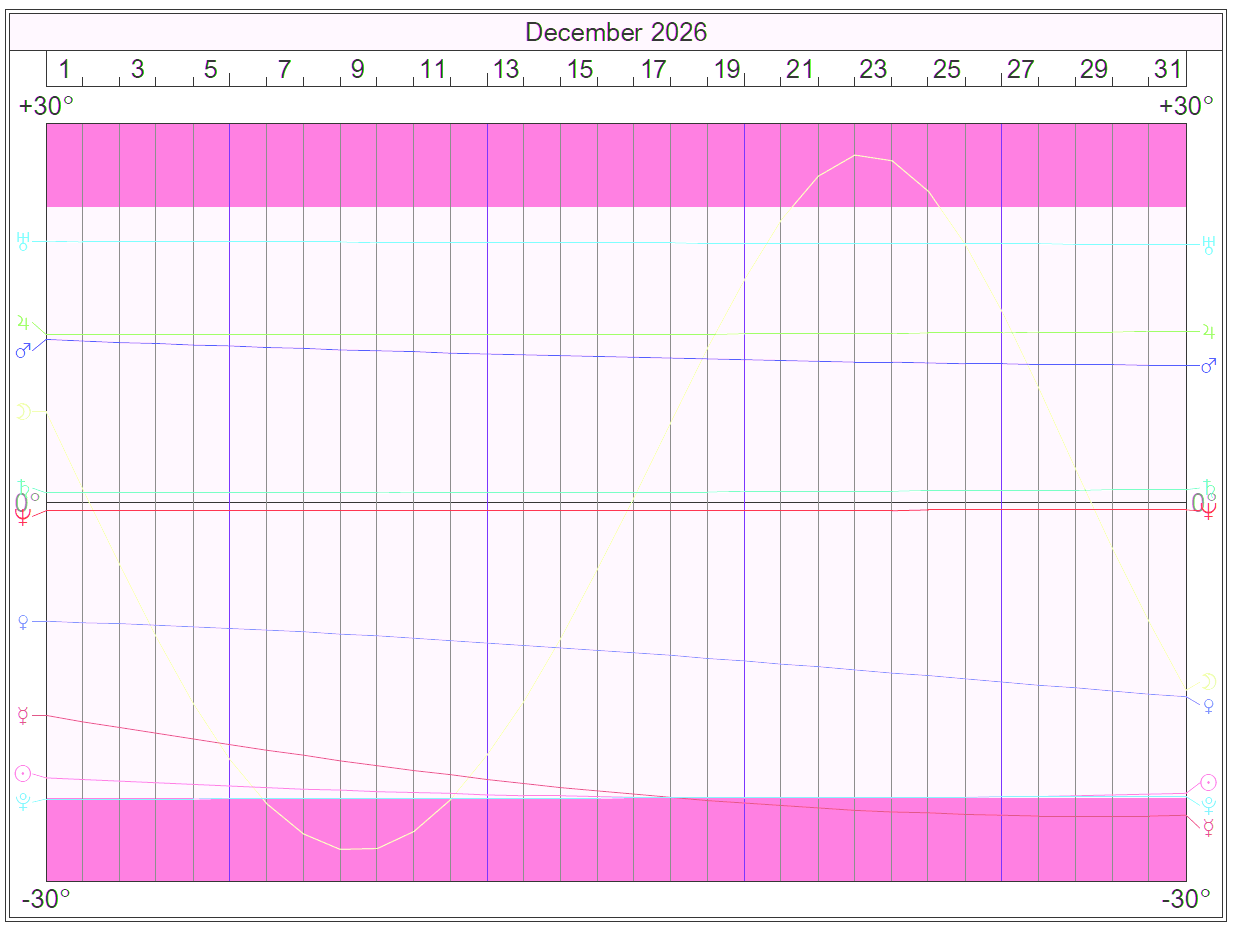
- Declinations December 2026
The full calendar of months for 2026 – Declination Graphs:
2026 Declinations Graphs Full Year (PDF)
More Months – 2025:
-
- Declinations January 2025
-
- Declinations February 2025
-
- Declinations March 2025
-
- Declinations April 2025
-
- Declinations May 2025
-
- Declinations June 2025
-
- Declinations July 2025
-
- Declinations August 2025
-
- Declinations September 2025
-
- Declinations October 2025
-
- Declinations November 2025
-
- Declinations December 2025
The full calendar of months for 2025 – Declination Graphs:
2025 Declinations Graphs Full Year (PDF)
Previous Months – 2024:
-
- Declinations January 2024
-
- Declinations February 2024
-
- Declinations March 2024
-
- Declinations April 2024
-
- Declinations May 2024
-
- Declinations June 2024
-
- Declinations July 2024
-
- Declinations August 2024
-
- Declinations September 2024
-
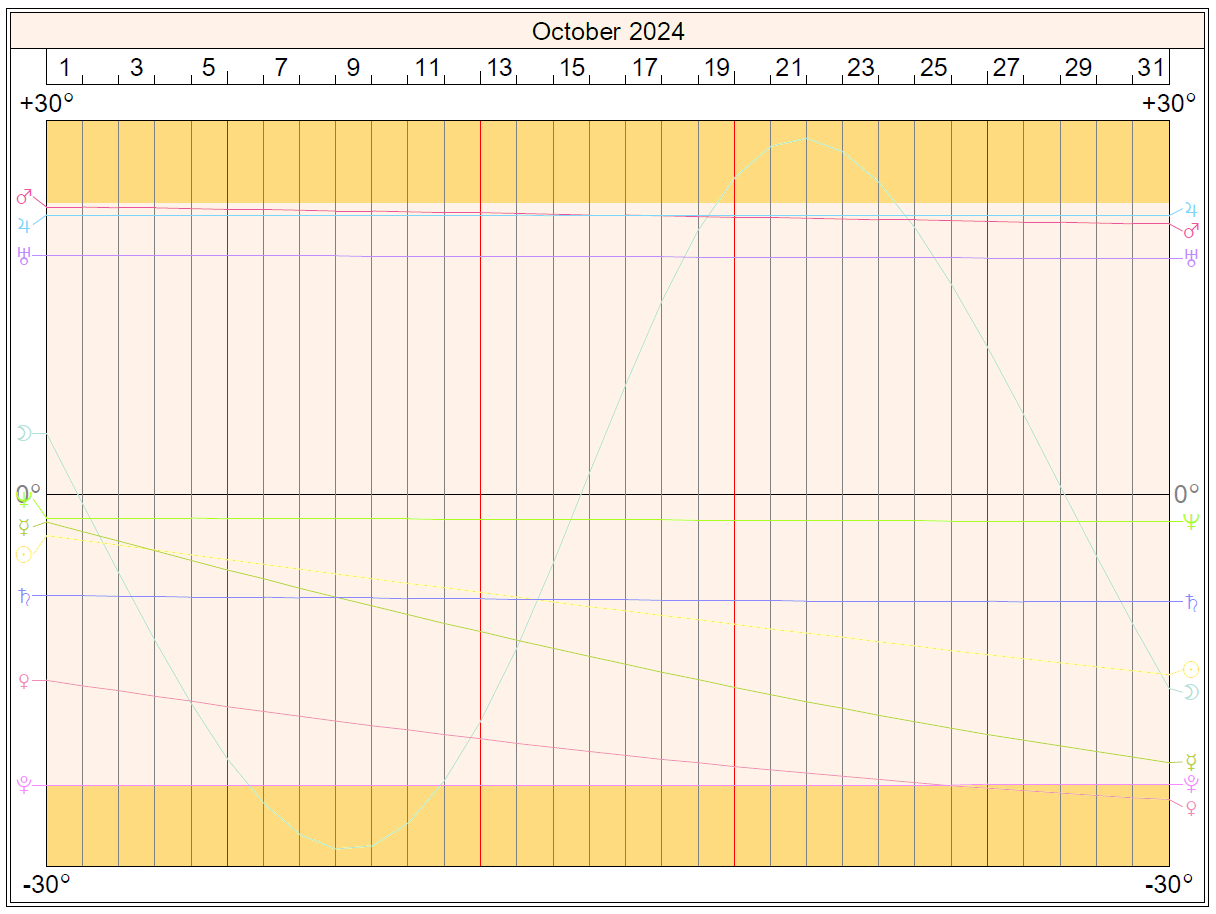
- Declinations October 2024
-
- Declinations November 2024
-
- Declinations December 2024
From the excellent Day Watch software by Matrix.
Back to This Month’s Ephemeris
On this page: Planetary declinations in graphical format for the current month and upcoming months.
See Also These Related Features:
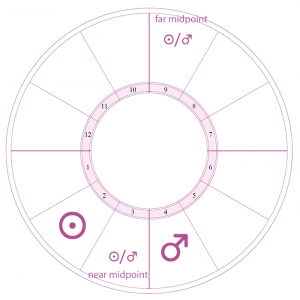
2027 Midpoint Transits
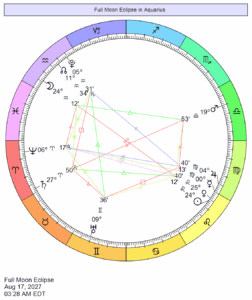
2027 Eclipse Charts
2027 Moon Phases
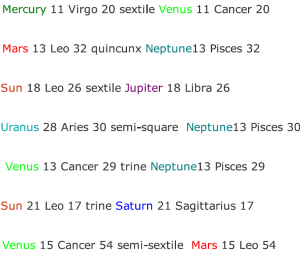
2027 Astrological Aspects
2027 Astrological Events
2027 Planetary Overview
2026 Midpoint Transits


